Tag: politics

Poor attendance record in the House of Lords?

I know my readers love a chart, and today I found some data I thought was begging for a good graphing. It’s the attendance figures for the House of Lords found in a report entitled “Members Leaving the House” – found at the bottom of this article. The motivation for the report is to explore the idea of retirement for peers, something some peers are seeking regardless of any other changes taking place. A secondary motivation is that there is wider reform of the House of Lords proposed, and one of the issues is that the new House is envisaged, ultimately to have substantially fewer members – this type of discussion informs how that transition might be achieved.

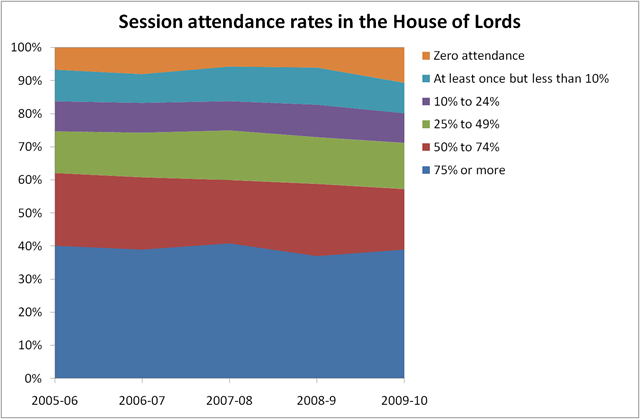
The report contains a set of tables for the last five years indicating the fraction of sessions which peers attended broken down into groups:

  • Attended 75% or more sessions
  • 50% to 74%
  • 25% to 49%
  • 10% to 24%
  • Attended at least once but less than 10%
  • Zero attendance

This is what the data looks like:

PeerAttendance

To give some idea of scale: across the period shown here the total number of peers decreased from 777 to 741, the average number of sessions in a year was 140, this latter figure means that a peer attending “less than 10% of sessions” was attending less than twice. It compares with the number of working days in the year of approximately 240 (48*5 day weeks). Nearly 20% of peers attend a session in the House of Lords only once or twice a year.

Being a member of the House of Lords isn’t a proper job, it does not attract a salary, although peers may claim a subsistence and office allowance of up to £26,000 per year. In this sense we should not anticipate the levels of attendance achieved by those working “normally”. Some of the peers will be paid as government or opposition working peers. However, peers do have a direct effect on the laws the country makes and turning up twice a year (which is all 20% of them achieve) does suggest a fairly low degree of interest – if I did something twice a year I wouldn’t even consider it a hobby, I go to the dentist more often!

A Coalition candidate for Oldham East and Saddleworth?

Following the news that Phil Woolas has lost his seat of Oldham East and Saddleworth for knowingly lying about his opponent, Graeme Archer has proposed on Conservative Home that the Coalition should put up a joint candidate selected in an open primary. Much as I respect Graeme on this I disagree, although I should point out this is a cautious rather than an emphatic rejection.

The function of a by-election is to selection an MP to represent a constituency in parliament, at a General Election this selection – repeated across the country – amounts to a decision on who should form the government. The General Election this year demonstrated that decision may not be clear.

Speaking from the point of view of a Liberal Democrat, potentially giving up the race in this seat would be damaging – it plays directly to the idea that the Liberal Democrats have been subsumed into the Tories. Should the LibDem candidate win in the Open Primary they would, almost inevitably be seen as the Coalition rather than the LibDem candidate. The great risk that the LibDems face during the Coalition is that as a minority party in a coalition they will be electorally damaged at the next General Election – this is observed in coalitions across Europe.

Successfully contesting a three-way election would illustrate how by-elections under coalition work, something that has been demonstrated already in the Thirsk and Malton by-election held over the summer. Furthermore it would help maintain the separate identity of the Liberal Democrats. I can join the Tory Party whenever I want, but I don’t want to – it is so blinding obvious to party members that the merger of the two parties is undesirable that amongst party members it is not even worth talking about. The public, and commentators need convincing of this.

From the point of view of the Coalition the situation is less clear cut, offering a combined candidate does demonstrate the joint nature of the Coalition, and the opportunity to argue the Coalition’s joint platform. However, at this point in a Government it would be difficult to see the by-election as a true referendum on their joint record, there are better ways of doing this than a by-election in a single constituency under special circumstances.

From a more practical point of view, as Tory Radio points out, it is more than likely that a faction within the losing party of the Open Primary would put up their own candidate.

Rather playfully I will point out to Graeme that the Open Primary followed by election scheme contains elements of an ad hoc election by alternative vote in the sense that there are multiple rounds of voting with candidates dropping out at different stages.

Why the other ways don’t work

In my last blog post I calculated how to raise money for various things (getting rid of tuition fees, avoiding any benefit reductions and so forth) using income tax; originally the more ranty bit to be found in this post was included, but it was getting a bit long so I separated analysis and rant.

Since the election there’s been a great deal of discussion of cuts, largely this has been framed in terms of a cut to X being apocalyptic where X is some area supported by its interest group. There has been rather less focus on what should happen in place of such cuts, proposing an alternative area for increased cuts has generally been tried: “waste, foreigners in the form of international development, benefit scroungers, Trident“ are ever popular – each of these contributes about £1bn or so per annum in spending – the gap we’re trying to match is about £80bn per annum. There have been some proposals for increased taxes to be paid by “someone else”, an increase in VAT met with considerable opposition (VAT is the third biggest element of tax – the change would raise about £13bn per annum), as was an attempt to cut child benefit for higher rate tax payers, raising about £2.5billion per annum.

The favoured targets for increased taxes are “the rich” and “tax avoidance”. “The rich” are normally defined as “richer than me and the people I know”, which is a poor definition. Tax avoidance, according to an HMRC report under the last government the size of the tax gap – the sum of avoidance (legal) and tax evasion (illegal) was around £40bn per annum. This is disputed with Tax Research UK giving a figure three times larger at £120bn. It’s difficult to see exactly how they manage such a high estimate – it’s seems to be based around the size of the “shadow economy” – things like illegal working. Regardless of this actually collecting the money involved in the tax gap would appear to be difficult: as announced by Danny Alexander there’s a hope that spending £200million per year will result in a tax recovery of £7bn per year. There’s an implicit assumption in tax avoidance that again it’s “the rich” who are responsible but it seem clear from reading the HMRC document that successfully addressing the tax gap would probably impact quite broadly. For example, buying wine in Calais is a tax avoidance; as is paying the builder, decorator and so forth in cash; as is purchasing items in Hong Kong via ebay. The company I work for has changed the way it pays some of my pension contributions to reduce the tax paid – presumably this would count as a tax avoidance too.

Vodafone is in the news at the moment for a £6bn tax avoidance. The £6bn figure is as calculated by Private Eye and is described by HMRC as “an urban myth”; Vodafone appears to have made provision of £2.2bn to address this issue and ultimately paid £1.25bn. It’s worth pointing out that the £6bn figure, accrued over 10 years is typically compared by protestors with a *yearly* benefit cut of £7bn. This sort of presentation leads me to believe that the proposer is somewhere on the innumerate-dishonest scale and discount whatever else they are saying. Taking the Private Eye “high” estimate this is £600million per year, taking the difference between the amount actually paid and the “low” estimate it amounts to £100million per year. Vodafone appears to have paid around £1bn tax on profit in 2009 amounting to a rate of 25% in that year, so it is not true that they pay “no tax”. It’s also worth noting that Vodafone appear to have the legal upper hand in the situation, given a judgement in the European Court of Justice.

At one time Trident or its replacement were cited as a source of ready cash – again the presented cost of up to £100bn is for the entire lifetime of the system of up to fifty years or so i.e. between £1bn and £2bn a year, regardless of this the decision on Trident has been pushed into the future (i.e. beyond the next election). A more likely figure for the Trident replacement is £20bn, or at most £34bn. I’ve said previously that I consider Trident to be Cold War willy-waving but scrapping it is not a big impact – particularly if there is any sort of replacement.

A useful rule of thumb for all these situations seems to be:

  1. Check that tax gain and spending are being compared on the same time period.
  2. Divide quoted tax gain by at least three since that will get you back to a more generally accepted figure.

The latest wheeze is chasing George Osborne for a £1.6million tax bill. Referring to our list above, (1) is met admirably this bill would be payable once, on the death of his father. Experience suggests the figure of £1.6million is fanciful. David Mitchell puts this so much better than me here in the Observer. It’s not that I am in favour of tax avoidance I just see efforts to address the problem by individual harassment as pointless. What is needed, as Mitchell points out, are changes in the law so that tax avoidance becomes tax evasion and is then illegal. It’s ridiculous to expect people to pay tax that they don’t legally have to – it’s not what the great majority of the population do – why expect companies and the rich to do any different?

I’ve yet to see any figures on the “cut deficit through growth scheme”, a priori I’m dubious since the ability of government to influence growth seems marginal and any scheme would need to stretch out beyond the 10 years that even Labour were planning to cut the deficit in by which time using my state-of-the-art recession prediction algorithm we will have experienced another recession, and another addition to the deficit.

I’m uncomfortable with the idea that we should demand services (no tuition fees, protected benefits) but rather than seeking a way to contribute to paying for these services personally try to push the payment for them onto a small fraction of the population. If you demand more money for X but don’t expect to pay any more for it then frankly I don’t think you’re committed to the idea.

Yields from income tax

This post is a tour of income tax and personal national insurance yields, it’s motivated by an interest in seeing how one might pay for a part of the reduction in the deficit through taxation. The reason for focusing particularly on income tax is that it yields a fairly large fraction of the total tax income (28.7% in income tax and 46.6% income tax and national insurance combined), as discussed in a previous post; this means that relatively large amounts of money are raised by relatively small changes when compared to other taxes. Furthermore it’s relatively easy to calculate: I can work out how much income tax I pay in a year but would struggle to tell you how much VAT I pay per year, the impact of a tax on insurance premiums the effect of a change on duty and so forth. Thirdly, it is the tax that is most transparently progressive, in the technical sense that the more you earn the greater the fraction of your income you pay in tax.
This calculation is based on a calculation of personal tax rates from wikipedia, this figure generates the tax rates programmatically and I simply translated the code to my computer language of choice – I thought about doing it in a spreadsheet but that turned out to be a bit brainbending. The second component of the calculation is the number of people in each income bracket: this information along with further information on incomes can also be found on wikipedia. Ultimately the data come from the HMRC. I’ve put these two bits of data together into a program which enables me to fiddle with tax rates, tax thresholds and so forth. It appears to be approximately correct since it matches roughly HMRC’s own figures on the effects of small perturbations to the tax system (pdf). This also tells you it’s possible to look this stuff up – but I find it more fun to calculate it myself! It’s also a good illustration of the general process of how to go about repeating someones calculations from literature sources: try to reproduce their graphs; try to match the summary numbers they produce.
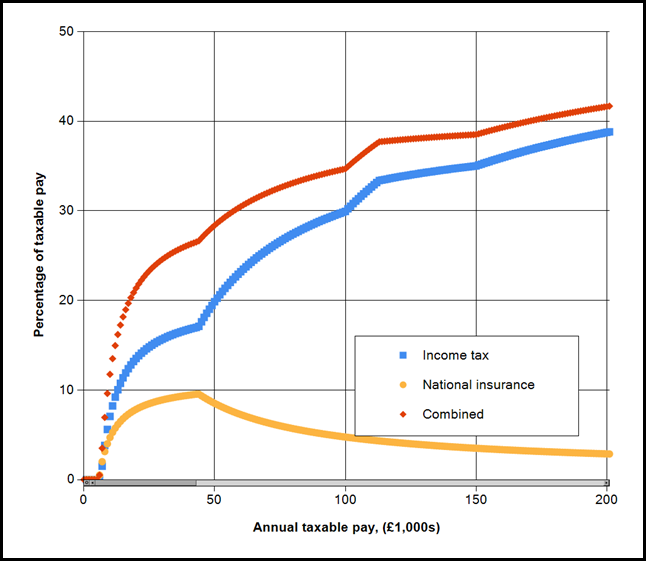
This first figure shows the income and national insurance payable as a fraction of gross (total) pay as a function of pay. The thing I hadn’t appreciated intuitively is that the tax banding system gives quite a smooth increase in percentage tax take, this is because you only pay raised rates on the fraction of your income that lies above the threshold:
TaxRatesAsAFunctionOfIncome
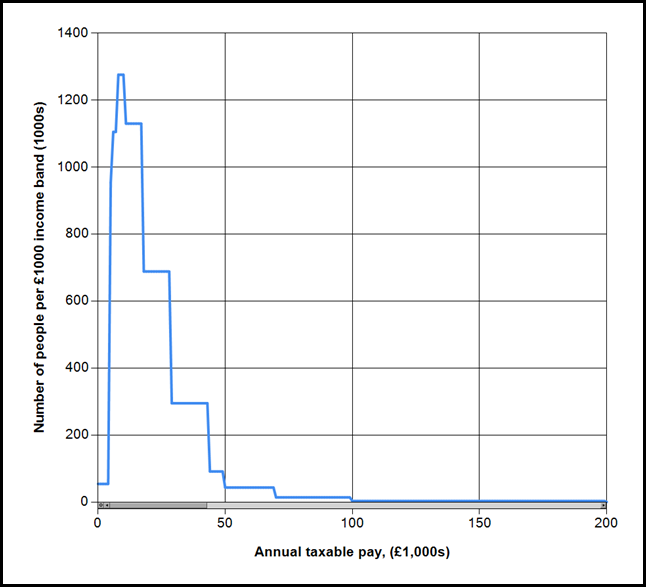
Extending the horizontal scale out towards incomes of £1,000,000 and the rate tends to 50%. The next figure shows the distribution of incomes, in the UK:
PopulationAsAFunctionOfIncomeBand
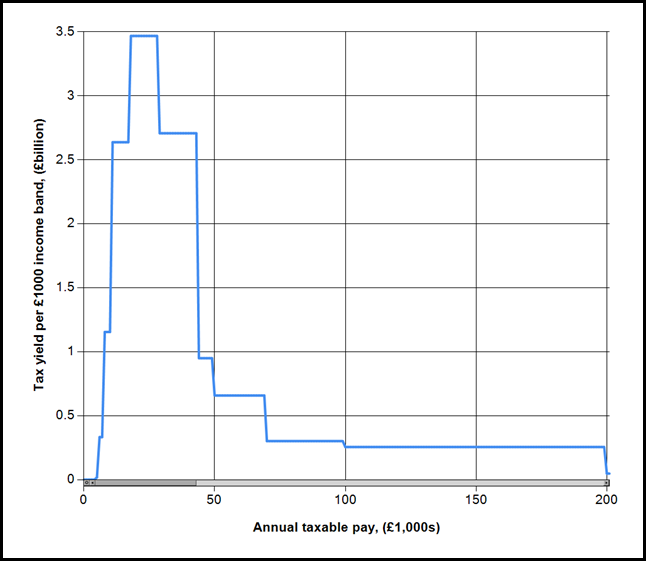
You can see the same information in text form here. The area under this curve between points on the horizontal axis tells you the number of people in an income band. The median income in the UK is £26k per annum – half the population earn more than this, half less. About 1% of the population earns more than about £100k per annum. This final figure shows the amount that each income band pays according to the latest tax rates.
TaxPaidAsAFunctionOfIncomeBand
To summarise this final figure in tax bands, the 20% band accounts for about 57% of tax paid, the 40% band for 26% and the 50% band for 17%. These bands contain respectively 90%, 9% and 1% of the income tax paying population.
In case you’re curious my salary puts me close to the top of the basic rate tax band.
To apply the knowledge embedded in these graphs to some recent problems:
As a rule of thumb: 1p on basic gives about £4bn, 1p on upper rate gives £0.75bn, 1p on the new 50% band gives £0.31bn. The reason for this sharpish dropoff is that relatively few people are effected by the upper rate tax changes so to yield a large tax income the rates have to be changed by a relatively large amount.
Reducing the threshold of the 40% tax band to £40k from £43k yields about £3bn.
The £20billion cut in welfare benefits is equivalent to approximately 5p on the basic rate of income tax, taking it to 24.5% from 20%. This would cost me about £1700 per year.
Tuition fees cost about £7.5billion (based on 1.5 million students each requiring an average £5k tuition fees per year), this is about 2p on basic rate. This would cost me about £800 per year.
The £2.5billion income gained from cutting child benefit from those in the upper tax band could be paid for with an increase in the upper rate to ~43% from 40%. Although it seems the £2.5billion figure is dubious. I can’t help thinking simply increasing the upper rate by this amount, rather than a convoluted attempt at clawback would be simpler. This isn’t to say I support the idea of paying child benefit to all regardless of income, just that implementing withdrawal in this way is technically complicated. This tax rise wouldn’t cost me anything!
I’ve not seen anybody volunteering for these tax increases to support their favoured causes, rather they prefer a range of schemes of dubious value impacting other people to avoid the problem falling upon themselves – a subject for my next post.
Note
This modelling was done using Visual C# running under Windows 7, if you’re interested either in the code or in just the application then let me know in the comments below (or on twitter). There are a couple of minor bits of tidying I’d like to do before release. Please note that the application is “good enough for blogging work” and should not be considered an accurate tool for tax calculations – it’s a toy to help me understand things!

Questions for undergraduates… cabinet edition

Thinking back many years to my first fraught days as an undergraduate, the three questions that came up most frequently as icebreakers between students were:

  1. Where are you from?
  2. What were your A-level results?
  3. What degree are you doing?

In this post I thought I would answer the third question, for members of the cabinet. The data is all culled from wikipedia:

Prime Minister David Cameron Politics, Philosophy and Economics (Oxford)
Deputy Prime Minister Nick Clegg Social Anthropology (Cambridge), Political Philosophy (Minnesota), MA European affairs(College of Europe)
Foreign and commonwealth affairs William Hague Politics, Philosophy and Economics (Oxford), Master of Business Administration (INSEAD)
Chancellor of the Exchequer George Osborne History (Oxford)
Justice Kenneth Clarke Law (Cambridge)
Home department Teresa May Geography (Oxford)
Defence Liam Fox Medicine (Glasgow)
Business, Innovation and Skills Vince Cable Economics and Natural Sciences (Cambridge), PhD Economics (Glasgow)
Work and Pensions Iain Duncan Smith Sandhurst
Energy and Climate Change Chris Huhne Certificate in French language and civilisation (Sorbonne); Politics, Philosophy and Economics (Oxford)
Health Andrew Lansley Politics (Exeter)
Education Michael Gove English (Oxford)
Communities and local government Eric Pickles Law (Leeds Polytechnic)
Transport Philip Hammond Politics, Philosophy and Economics (Oxford)
Environment, food, rural affairs Caroline Spelman European Studies (Queen Mary College)
International Development Andrew Mitchell History (Cambridge)
Northern Ireland Owen Paterson History (Cambridge)
Scotland Michael Moore Politics and Modern History (Cambridge)
Wales Cheryl Gillian Law
Culture Olympics Media and sport Jeremy Hunt Politics, Philosophy and Economics (Oxford)
First secretary to the treasury Danny Alexander Politics, Philosophy and Economics (Oxford)
Leader of the House of Lords The Lord Strathclyde Bachelor of Arts (UEA)
Minister without portfolio The Baroness Warsi Law (Leeds)

As a scientist this is both depressing and comforting, depressing because of 23 members only 2 has any sort of scientific training: Liam Fox and Vince Cable (the latter of whom only did science in his first year). Comforting because at least we don’t get the blame!

It also highlights once again the dominance of the Politics, philosophy and economics degree at Oxford in providing Cabinet ministers – I haven’t checked but I believe this applies to previous cabinets.