Category: Technology

Programming, gadgets (reviews thereof) and computers

Product review: Dwarflab Dwarf 3 Smart Telescope

In a change from the usual service I am reviewing a product today, a telescope. More exactly the Dwarflab Dwarf 3 smart telescope.

The Dwarf 3 mounted on the Dwarflab Mini Tripod

It’s not my first telescope review, I also own a Celestron Nexstar 5SE – a more conventional telescope.

I was interested in a new telescope because we have started home education and my son has an enthusiasm for astronomy. Showing him the ropes on my Celestron was a bit frustrating, the built-in controller uses a tiny two line display and a numeric key pad, and to do imaging requires a rather uninteresting set of random adaptors and connectors some of which need careful alignment. Initially I was looking for something more convenient than my DSLR for imaging but for roughly the same money I could get a whole new smart telescope!

Smart telescopes are a relatively recent innovation. Telescopes have been more and more automated over the years but in the last few years they have broken free from the conventional telescope formats to produce devices like the Dwarf 3 shown in the image above – it has no eyepiece for direct viewing and is entirely controlled by an app.

When buying the Dwarf 3 I looked at entry level smart telescopes below £1000 in price so the main contenders were the Dwarflabs models and ZWO Seestar models. I chose the Dwarf 3 because it was a little more portable than the Seestar models, it explicitly supported wildlife and landscape imaging and it was also a little bit cheaper. Reviews suggested that its software was more flexible. The Dwarf 3 was £459, I bought it from First Light Optics and it was delivered within 24 hours of ordering!

I also bought the Dwarflab Mini Tripod for an additional £73. The tripod is a solid piece of kit with angle scales on the rotational elements in the head, it is best suited to use on a table since it is quite short. It is rather more expensive than entry level tripods but cheaper than premium brands like Manfrotto. I can also use the Velbon tripod I already own – the Dwarf 3 takes a standard camera mount thread.

In the Dwarf 3 package you get the scope, a soft carry case, neutral density filters for observing the sun, a lens wipe, a USB-C to USB-C cable and a very thin manual. The manual tells you how to pair your phone to the scope from which you can use the Dwarflab app to control the scope and that is all. My phone has an NFC reader so I can just “tap to connect”. It seems this connection process has been improved since the Dwarf 3 was first released.

The cylindrical lens housing of the telescope can be twisted, and the whole device be twisted on its base so you can point the telescope without the app but the app is required for everything else including looking through it!

The video tutorials accessible from the Dwarflab app are definitely worth watching, you can find them here.

The Dwarflab app, and the telescope are clearly undergoing rapid software updates. I was prompted to upgrade the firmware of the telescope on my first night-time try so that I could access functionality available in the app. There were two small updates that installed quickly and cleanly. I bought a 2026 third party manual which although very readable and useful is clearly out of date in terms of the details of the software. There is an official manual from Dwarf lab in PDF format here, it is 280 pages long.

The Dwarf 3 has a wide angle and a telephoto camera; you can see a live view from both on the connected phone in “picture in picture” format. It is easy to switch the main view between telephoto and wide angle cameras. The wide angle is equivalent to a 45mm focal length lens on a 35mm film format camera, and the telephoto is equivalent to a 737mm focal length lens and has a focal ratio of f/4.3. For comparison the Celestron Nexstar 5SE has a 1250mm focal length lens with f/10 focal ratio, the 5SE is currently about twice the price of the Dwarf 3.

The wide angle lens makes aligning on the sun and moon ridiculously easy – you just steer towards the appropriate location using the wide angle lens to put your target in the guide box at the centre of the frame and then switch to the telephoto view. I found aligning my conventional Celestron on the sun really hard because the sun nearly fills the field of view, there’s no indication you are getting close and I could not use my guide scope. The results of my first imaging forays with the Dwarf 3 can be seen below, as well as the sun I caught a sliver of moon early one morning.

Photo of the sun through a solar filter, a black background with an orange sun showing sunspots near the centre of the disk
Photo of the sun taken using a Dwarf 3 smart telescope. Chester. 2026-10-07 14:23
Photo of the moon taken using a Dwarf 3 smart telescope. Chester. 2026-10-08 06:35
Photo of the moon (cropped) taken using a Dwarf 3 smart telescope. Chester. 2026-10-08 06:35

I also took an image of Jupiter in the early morning, it was easy to see the disk of the planet but I could not see the banding of the clouds or the Galilean moons, this was probably because it was getting light and the sky was brightening.

I took the sun and moon photos in “Solar System” mode, there are also General, Deep Sky, Milky Way, Star Trails, Auto-capture and Pano (Panoramic) modes. Alignment for the Deep Sky and Solar System modes is automatic, you point the telescope at a starry sky and it works out where it is pointing from the stars in frame – you can then pick your target from the star atlas and it will go to them automatically.

This means the challenge in astrophotography with the Dwarf 3 is optimising your imaging parameters and post-processing rather than setting the scope up or finding the target.

Update 12th October – took this image of the Andromeda Galaxy (M31) last night, the exposure time is about an hour. The process was to open up the star atlas and click on the photo button next to M31! It was embarrassing simply but exciting to see the image building up.

Photo of the Andromeda Galaxy (M31) taken using a Dwarf 3 smart telescope. One hour exposure. Chester. 2026-10-11 20:30

I took some wildlife pictures in my back garden, these were not ideal since my garden is small, consequently reasonably sized animals more than filled the frame. The telescope cannot move very fast so you need to find focus on a location and wait for wildlife to appear. In theory it will track moving objects but I suspect this will only work for small ones moving slowly close up or larger animals further away. It might be worth a try at my local wetland bird reserve.

Photo of a squirrel (cropped) at about 5 metres range

This review is written on the basis of only a few days use. I think this is probably the best £500 I have spent for a while, to get a reasonable image of the sun, moon and Jupiter was very easy – the work of a few minutes. The Dwarf 3 is just so much fun to use. There is clearly scope to improve these images with the flexible software provided. The Dwarf 3 is as portable as a DSLR camera, so taking it on a walk or holiday is a simple exercise.

Now all I need are clear skies!

hdx-cli-toolkit – a tool to examine and update metadata in the Humanitarian Data Exchange

the HDX and CKAN logos

This post introduces the hdx-cli-toolkit – a tool written in Python to examine and update metadata in the Humanitarian Data Exchange (HDX) which is based on the CKAN data catalogue.

HDX is a project of the UN Office for the Coordination of Humanitarian Affairs (UNOCHA). It is a data catalogue focussed on sharing data relevant to relief efforts. The data come from a wide range of providers who can upload data and the related metadata either manually or using automated pipelines. A team at the Centre for Humanitarian Data manage HDX: approaching providers for new data, working on data quality, enhancing HDX, and writing pipelines to automatically add data. I was involved at the start of the HDX project in 2014.

The hdx-cli-toolkit grew out of my recent time as a consultant on a return to the HDX project. The team I was in received numerous internal queries relating to metadata on HDX that couldn’t easily be answered by using the HDX user interface or CKAN API but were amenable to solution using relatively small pieces of Python code. Rather than scatter around small pieces of one-off code I decided to write a command-line tool to collect together this code and make it re-useable by others.

I also use hdx-cli-toolkit as a point of reference for doing various operations in the Python language (configuring a Python project, command-line interfaces with the click library, tests with mocks, publishing to PyPI, configuring Visual Studio Code for Python development) as well as snippets of code for interacting with HDX which may be used in data pipeline code.

As an aside, my post on understanding Python project setup is the most popular one I have written by a large margin.

Overview

hdx-cli-toolkit supports the following commands:

  • configuration – Print configuration information to terminal
  • download – Download dataset resources (files) from HDX
  • get_organization_metadata – Get an organization id and other metadata
  • get_user_metadata – Get user id and other metadata
  • list – List datasets in HDX
  • print – Print datasets in HDX to the terminal
  • quickcharts – Upload QuickChart JSON description to HDX
  • remove_extras_key – Remove extras key from a dataset
  • scan – Scan all of HDX and perform an action
  • showcase – Upload showcase to HDX
  • update – Update datasets in HDX
  • update_resource – Update a resource in HDX

Installation

hdx-cli-toolkit is a Python application published to the PyPI package repository. It can be installed easily with:

pip install hdx_cli_toolkit

Users may prefer to make a global, isolated installation using pipx which will make the hdx-cli-toolkit commands available across all of their projects:

pipx install hdx_cli_toolkit

hdx-cli-toolkit can then be updated with:

pipx install --force hdx_cli_toolkit

hdx-cli-toolkit uses the hdx-python-api library, this requires the following to be added to a file called .hdx_configuration.yaml in the user’s home directory.

hdx_key_stage: "[an HDX API token from the staging HDX site]"
hdx_key: "[an HDX API token from the prod HDX site]"
default_organization: "[your organization]"

The default_organization is required for the configuration command and can be supplied using the --organization= command-line parameter. If not defined it will default to hdx.

A user agent (hdx_cli_toolkit_*) is specified in the ~/.useragents.yaml file with the * replaced with the user’s initials.

hdx-cli-toolkit:
    preprefix: [YOUR_ORGANIZATION]
    user_agent: hdx_cli_toolkit_ih

Usage

Details of the currently implemented commands can be revealed by running hdx-toolkit --help, and details of the arguments for a command can be found using hdx-toolkit [COMMAND] --help

A couple of simple invocations, this first one prints out all the metadata for a dataset in a readable JSON format:

hdx-toolkit print --dataset_filter=geoboundaries-admin-boundaries-for-nepal --with_extras

This one shows the value of a particular metadata element for a set of datasets. The list command works in conjunction with the update command in which case the --value option provides the value to update to:

hdx-toolkit list --organization=healthsites --dataset_filter=*al*-healthsites --hdx_site=stage --key=private --value=True

A detailed guide including many example invocations can be found in the USERGUIDE.md file

Using APIs with Excel and Power BI

Introduction to APIs

Application Programming Interfaces (APIs) are a standard way for computers to communicate with each other. In this article I am going to show how to use Power Query to access data sources on the web via APIs. Power Query is a feature available in versions of the Excel desktop app after 2016 and in the online version of Excel in Microsoft 365, as well as Power BI.

I will use the HDX Humanitarian API (HDX HAPI) as an example data source but the methods described here are general. HDX HAPI is a system for accessing humanitarian data hosted by the UN Office for the Coordination of Humanitarian Aid (UNOCHA), it is a project I first worked on at its foundation 10 years ago.

This tutorial shows how to access the data in HDX HAPI using the Excel “point and click” interface, and then by editing the text of the query in the Power Query Advanced Editor which allows more complex processing of the data – including paging data in an API until it has all been downloaded.

Opening a JSON file from the web

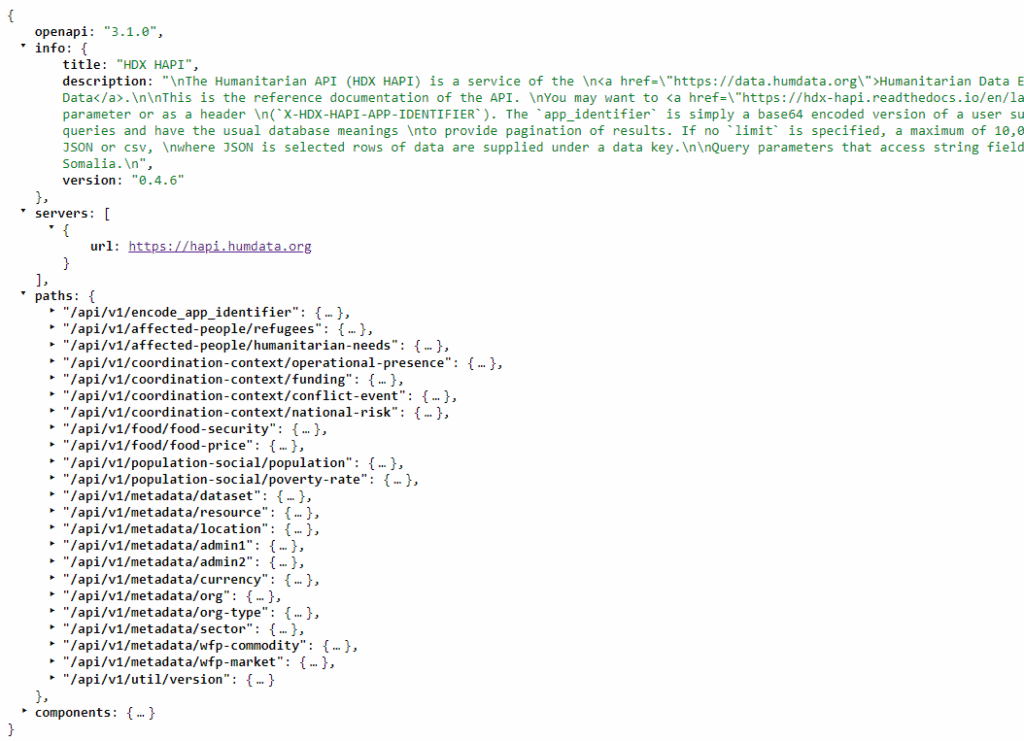
The simplest data we can access from HDX HAPI is the machine-readable description of the API, including the available endpoints, which is found in a file at https://hapi.humdata.org/openapi.json. We start with this because we don’t have to worry about authorization or building a complex query URL, so we can focus on the process in Excel Power Query. The file we are reading is in JSON format and looks like this in the browser:

An example of an OpenAPI JSON document

This is a simplified view, there is further information including a summary and description for each path in the paths section which we have hidden.

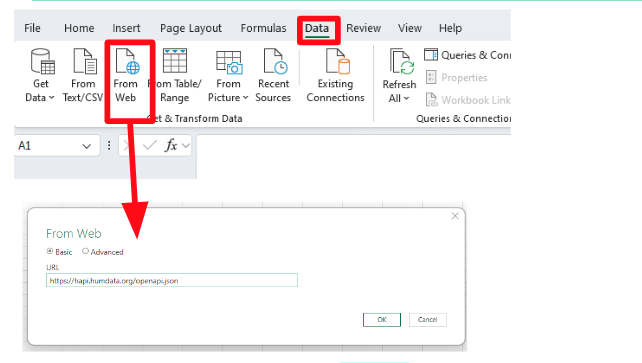
To open this file in Power Query we go to the Data tab in Excel and click the From Web button. This pops up a From Web dialog box with a space to add a URL – so we paste our URL in there and click “OK”. 

A screenshot showing how to access data from the web in Excel

This brings up the Power Query Editor and shows us this data:

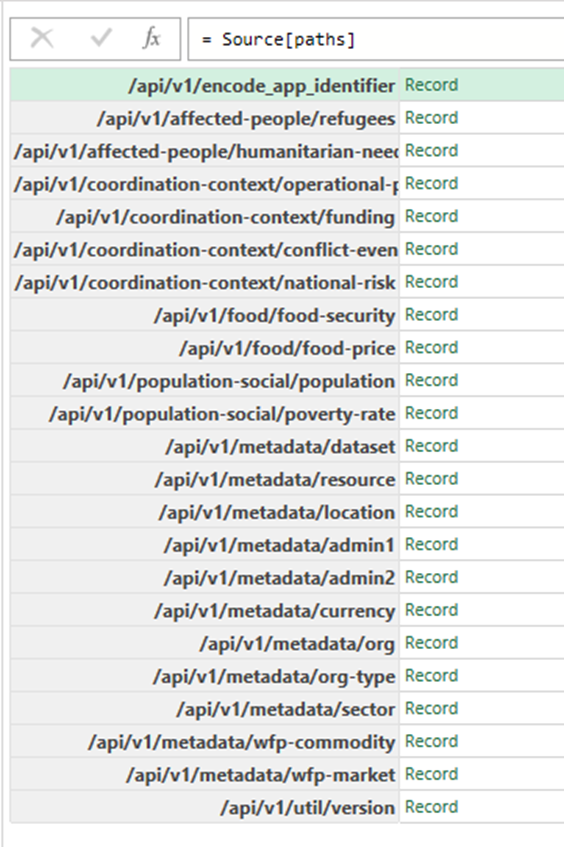
We are interested in the paths section because that lists the different datasets in the API. If we click on the green record next to paths then we see a list of the endpoints:

A screenshot of the OpenAPI JSON document as it appears in Excel

We can pull them into an Excel spreadsheet by clicking Into Table and then Close & Load buttons. This gives us a list of the available endpoints in an Excel table.

Using an API with Power Query

Next we will load data from one of the HDX HAPI endpoints using Power Query. We’ll use the metadata/admin2 endpoint which contains a table of data about geographic administrative areas. We start by visiting the HDX HAPI API documentation page (https://hapi.humdata.org/docs#) which allows us to try out queries to the API, the output of this process is a query URL which contains all the information we need to make a query to the API.

Making an app_identifier for HDX HAPI

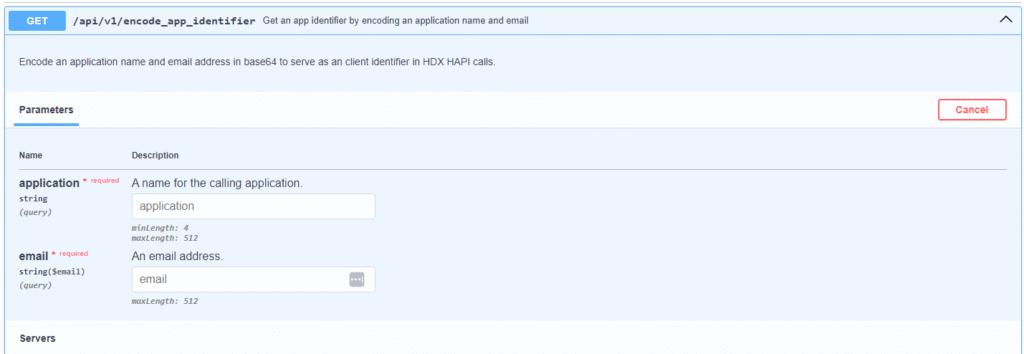
The first step is to make an app_identifier HDX HAPI which we will use to authorize subsequent queries – that is done with this query: (https://hapi.humdata.org/docs#/Generate%20App%20Identifier/get_encoded_identifier_api_v1_encode_app_identifier_get ), we need to provide and an email address and an application name:

A screenshot showing how to generate an app_identifier in HDX HAPI

Building an HDX HAPI Query URL

The next step is to design a query for the dataset we are interested in, remembering to include the app_identifier we have just made. Typically the query endpoints allow the user to supply a number of filters to limit the number of rows of data returned. You might prefer to do this type of filtering once you have the data in Excel or Power BI although for some datasets the amount of data returned will be large in which case limiting the data returned by country using the location_code or location_name query parameters is probably the best place to start. 

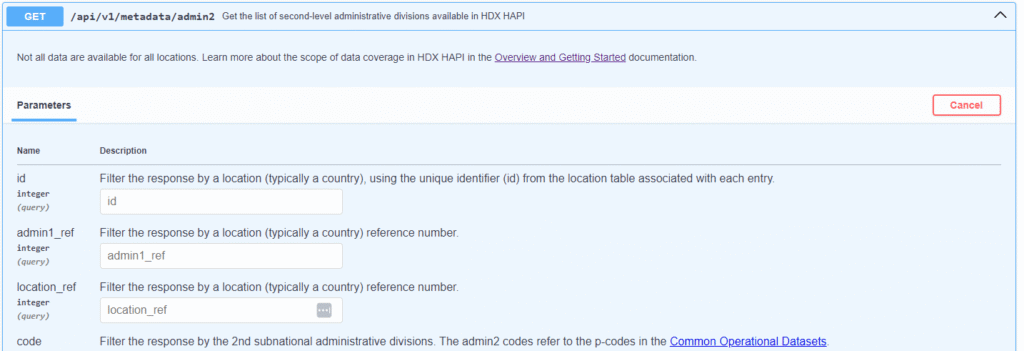
The documentation for the metadata/admin2 endpoint can be found here: https://hapi.humdata.org/docs#/Metadata/get_admin2_api_v1_metadata_admin2_get 

A screenshot showing details of the admin2 endpoint in HDX HAPI

From this we can make the following query URL:

https://hapi.humdata.org/api/v1/metadata/admin2?output_format=csv&app_identifier=[app_identifier]&limit=6000&offset=0

Notice that we have selected CSV output_format in this case, and we have set the number of rows returned to 6000. I have put in a placeholder for the app_identifier – you should past in the value you created above.

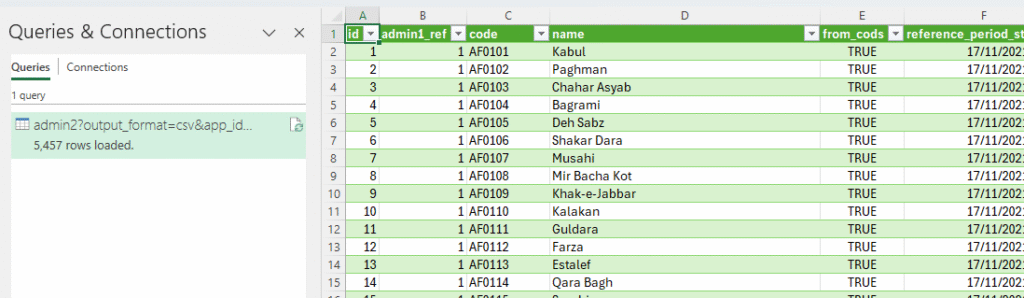
We can get the data by simply copying this URL into the Data->From Web dialogue box, since the data is in CSV format no further steps are required to fetch the data. On returning to Excel we should see this:

Screenshot showing data from the HDX HAPI API imported into Excel

Notice that we downloaded 5,457 rows which is all of this dataset, luckily we set the limit to 6000 rows so we got all the data in one query. We talk more about this below when we discuss the use of the Advanced Editor.

Once we’ve loaded data into an Excel table we can process and the chart the data in any way we see fit.

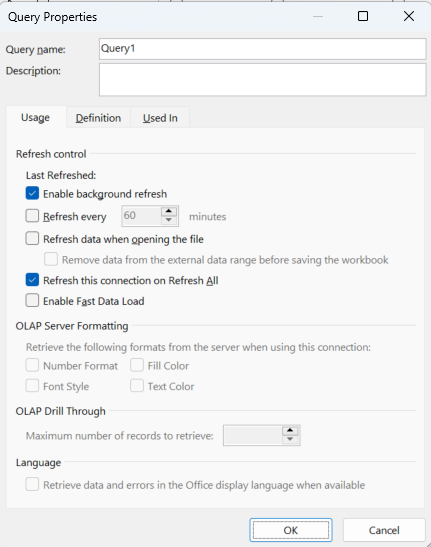
If we right-click the query entry in the Queries & Connections section we get query properties which allow us to control when data is refreshed – this means we can build a “live” report in Excel whose data is updated every time we open it or even more frequently:

Screenshot of the Excel Query Properties dialogue which controls data refresh

Get more control with the Advanced Editor

For both the OpenAPI definition query and the HDX HAPI query we were able to get useful data without coding, just using the “point and click” interface. We can get more control of the data import process by using Power Query’s Advanced Editor. 

The Advanced Editor is accessed in one of two ways, if we have an existing query then we can return to our Power Query Editor window we can click on the Advanced Editor button in the Home tab. Alternatively we can go to the Excel Data tab and select Get Data->Launch Power Query Editor and then on the right of the window select New Source->Other Sources->Blank Query, and then click on the Advanced Editor button, as before.

For the OpenAPI import the text of the query that Excel made as a result of our point and clicking looks like this:

Screenshot of the Advanced Editor for Power Query for opening the OpenAPI JSON file

It is written in M Language which is not found outside Power Query – the “M” stands for “Mashup” and it bears some resemblance to Microsoft’s functional programming language “F Sharp”. In M Language a function is defined with the “let” keyword and the returned value is found after the “in” keyword. Statements are separated with commas. Arrays are defined with curly brackets, and the data inside associative arrays are created and accessed using square brackets. Variable names can contain spaces but in this case they must be enclosed in double quote marks and preceded by a #.

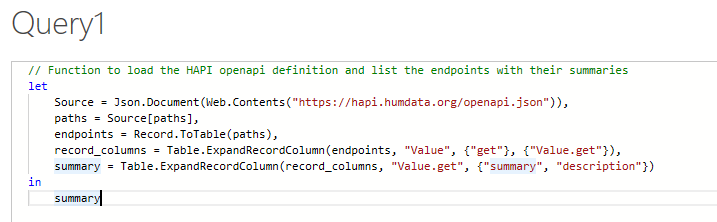
We can improve our OpenAPI import by writing our own query which extracts the summary and description columns for each endpoint and presents them together in a table: 

A screenshot of a refined Power Query for the OpenAPI JSON data

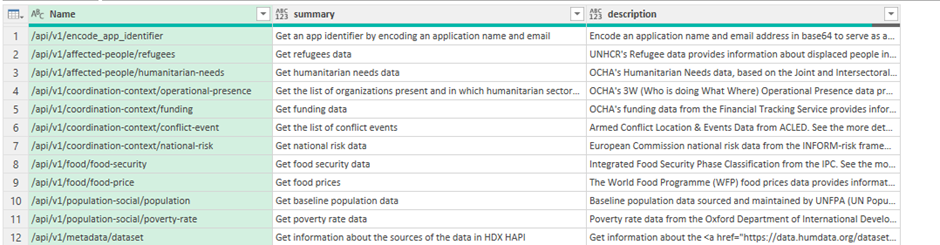
The text for this query can be found here. When we click Done on this query we see the endpoints are now listed with summaries and descriptions:

Screenshot of data from the OpenAPI JSON file in Excel as produced by the improved Power Query

For the query to the metadata/admin2 HDX HAPI endpoint we had a small issue in that we had to guess how many rows of data there were, and set the limit parameter larger than this value. This approach is not great because we had to discover this by trial and error, and if there had been more than 10,000 rows, the maximum we can supply to the API, we would have been stuck.

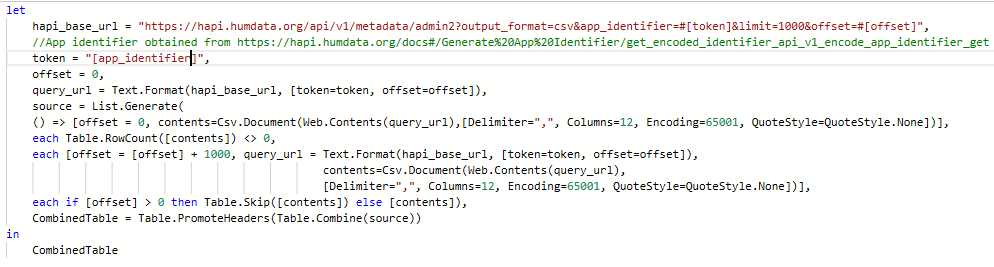
We can fix this issue by copy/pasting the following code into the Power Query Advanced Editor as we did above, remembering to add in our own app_identifier:

Screenshot of an improved Power Query for loading multiple pages of data from the HDX HAPI API

The text for this query can be found here.

This function will compile all of the data for the query into a single table, continuing to fetch data until it reaches the end of the dataset. It works by using the List.Generate function to produce a list of tables of data which use a sequence of offset query parameters – you can think of the offset as a start point for a new page of data. The list terminates when no data is returned and then the list of tables is combined into one table to put into Excel. There is a little bit of code to ensure that we don’t repeat the column headers inside our data, which in CSV format are returned for each page.

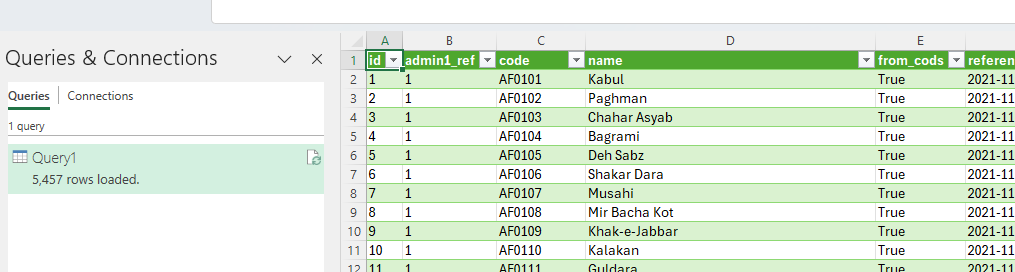
The result of running this function looks like this:

Screenshot of data from HDX HAPI in Excel

As you can see, we have loaded all 5,457 rows.

A benefit of the Advanced Editor approach is that it is easy to share simple recipes for fetching and processing data with others.

Using Power Query in Power BI

In the above we used Power Query in Excel to access data in HDX HAPI, the process in Power BI should be nearly identical. The only difference is that the Get Data menu item appears on the Home menu of Power BI. In practice we found that the OpenAPI query failed using the “point and click” method although both queries worked using the Advanced Editor route.

Summary

We have shown how Excel’s Power Query language can be used to access the data in HDX HAPI, first by using the “point and click” interface but then by making use of more sophisticated queries in the Power Query Advanced Editor which select particular items of data or retrieve multiple pages automatically. We also show how refreshing the data from the API can be controlled. The techniques demonstrated here should apply to any API which returns JSON or CSV format data on the basis of simple HTTP GET requests.

Game Review: Black Myth Wukong

In a break from usual service I am reviewing a “computer game”, Black Myth Wukong by Game Science Interactive Technology. I started gaming in the early eighties when I was an early teenager, I think there was a bit of a break when I went to university then I continued into my early thirties (around 2000). There was then a pause until a while after my son was born, we got a PlayStation 5 in Christmas 2021 “for him”.

Since then my favourite games have been Horizon Zero Dawn, Horizon Forbidden West, Elden Ring, Lies of P and Ghost of Tsushima. I bought Black Myth Wukong with my Christmas money – a child once again! In common with my other favourite games it falls into the category of “action role-playing” game.

Black Myth Wukong is based on Journey to the West, a 16th century Chinese novel which I know from an eighties TV series which I remember by its short name “Monkey”. In the game you play the part of “the Destined One” (a monkey) whose task is to retrieve the six relics of Sun Wukong.

The action takes place over 6 chapters, it is closest in style to Lies of P, that’s to say the chapters involve a roughly linear path with battles with minor characters who respawn and bosses who you must defeat to progress. Defeating a character brings rewards, “will” which is the unit of progress used to upgrade your character and buy upgrades and consumables and also items. Fighting is action rather than turn based. Your weapons are a trusty staff (which can be replaced and upgraded through the games), and various spells which fall into several categories: active spells, defensive spells, transformations, spirits, vessels. There’s a huge range of spells and so forth to choose from. My favourite is “Pluck of Many” which summons a posse of replica monkeys to fight for you (but only for a brief period).

Black Myth uses the traditional trifecta of health, stamina and some consumable spell substance (Mana in this case) to indicate your current status. A couple of vessels and spirits are tied to a second mystical substance, Qi and spells have a cooldown period so you have to wait to use them again. Health is recovered by drinking from your gourd which contain a variety of upgradable drinks and “soaks” which have various effects. I think it’s best to think of the “soaks” as teabags! You can also collect a variety of modifying relics which can be equipped to boost various characteristics.

I liked the upgrade and progress mechanics, there are extensive skill trees but you can re-allocate “sparks” freely at the save points (shrines). Dying does not lose your accumulated will, which is an irritating feature of Elden Ring and similar. I have died futilely so many times in Elden Ring attempting to retrieve my accumulated experience points.

The graphics in Black Myth are stunning, a step above even Elden Ring and Lies of P which are excellent. This will be down, in part, to Unreal Engine 5. The chapters also have quite different visual styles – the first chapter, set on Black Wind Mountain is lush forest, the second Yellow Wind Ridge is scorched desert, the third the New West is snowy mountains, the fourth The Webbed Hollow is a creepy, cavernous underground environment, the fifth Flaming Mountains is a scorched volcanic moonscape, the final chapter Mount Huaguo is a mountainous, forested open world. In addition there are a couple of “secret” areas which are accessed by completing quest lines. The gameplay also varies a bit with chapter with some chapters like Yellow Wind Ridge and The Web Hollow feeling close to open world.

Your enemies are well-designed and have a very wide range of attacks, your own spells are very varied and both are rendered beautifully. I found the dodging animations particularly satisfying. I thought the in-game dialogue and interactions with characters was pretty good. Games Science is a Chinese studio and were a couple of places where translation seemed slightly odd (I’m thinking of the “non-white” and “non-able” bosses).

There is no difficulty level selection, so if you are struggling with a boss to progress then you have to “git gud” which is sometimes a pain. I have a sneaking suspicion that some of those most challenging bosses are amenable to tactics which you simply need to find rather than being straightforward battles of skill and reflex. Fall damage is not an issue until it is, in parts of Chapter 3! There is very limited parrying in Black Myth, which some will miss.

I got about a month of play out of Black Myth for the first run through, amounting to 98 hours gameplay but there is New Game+ to play and a couple of challenge features where you can refight bosses, this is well used to beat those foes that you first struggled with early in the game.

Overall I loved Black Myth Wukong, I can’t wait for the rumoured DLC

Rosetta Stone – Rust

In an earlier blog post I explained the motivation for a series of “Rosetta Stone” posts which described the ecosystem for different programming languages. This post covers Rust, the associated GitHub repository with some minimal code is here. This blog post aims to provide some discussion around technology choices whilst the GitHub repository provides details of what commands to execute and a minimal example project.

I became interested in Rust because a number of new tools such as uv and ruff for the Python ecosystem are written in Rust. It’s fair to say there has been a buzz around the language in programming circles for some years.

About Rust

Rust started out as a personal project by Graydon Hoare, an employee of Mozilla, in 2006. It was adopted by Mozilla in 2009 and in 2012 the first public release was made. It was originally designed with a focus on memory management and memory safety. It stands with C and assembly as the only languages supported in the development of the Linux kernel. I read the The Rust Programming Language book recently, the distinguishing feature of Rust is the borrow checker and ownership model which is what gives it strong memory safety credentials.

Rust is named for the rust fungi, not the corrosion of iron but it seems few people realise this!

Rust currently ranks 13th on the TIOBE index but has been regularly voted the most admired language on the Stackoverflow rankings.

How is the language defined?

The home for the Rust language is here. Rust evolves through an RFC (request for comments) process, which can be found in the Rust RFC Book. Currently there is no formal specification for the language but there is an exercise to write one.

New versions of the language are released every 6 week (see here). Breaking changes can be introduced in editions (once every 3 years with the next edition, 2024, due in February 2025) but upgrading between editions is optional and there are tools to support version migrations. For more about the edition process see here.

There is a roadmap for the 2024 edition (see here) and presumably once that is released the next roadmap will be developed.

Rust Compilers

The Rust compiler is rustc, there are some alternatives but they are experiments rather than production systems. Typically rustc is invoked with the cargo package manager, see below. My first impression was that the compiler provided really good error messages.

Details of installation can be found here in the accompanying GitHub repository. Installing the whole Rust toolchain is ridiculously simple.

Package management

cargo is the Rust package manager, it is also typically used to compile code to produce a “crate” which may be a binary or library.

Rather neatly invoking cargo to produce a new package also creates a new Git repository with the appropriate layout:

cargo new hello_world --bin

This generates a cargo.toml file which defines the project and dependencies, and on compile a cargo.lock file is produced which specifies exactly the versions of all the dependences. This parallels the NPM system for JavaScript/TypeScript. There is also a --lib flag which generates a layout for a library package. In practice this is just a starting point, your code may include both binaries and libraries for which you will need to edit the cargo.toml file. However, this cargo new process reflects how I would start a project in Python.

The standard library is here, there are no built-in CSV or JSON libraries – regular readers will recall I use this as a measure of a language’s completeness since my favoured language, Python, has them! Others may have different opinions.

Third party Rust crates can be found on the crate registry.

Virtual environments

Rust does not require virtual environments since cargo fetches the appropriate packages on compile, it uses a local cache of packages but this is a true cache – if the version of a package is not in the cache then it is fetched.

Project layout for package publication

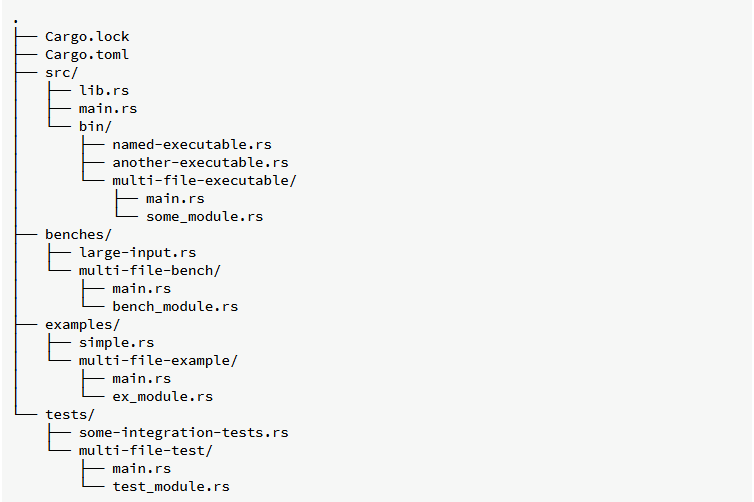
cargo new generates a minimal project layout. More generally the conventional project layout is shown below (see here) when code is compiled a target directory is created for the compiled code.

It is rather nice having a mandated project layout!

Testing

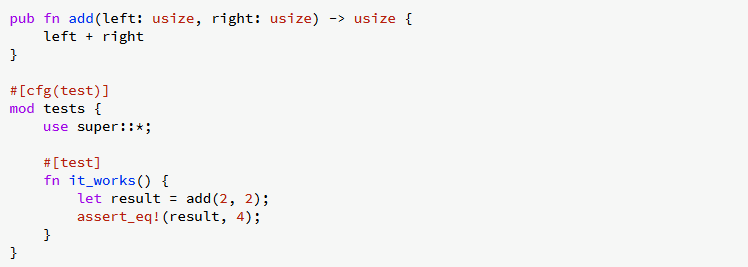
A testing framework is built-in and a skeleton test is included when a --lib project is created by cargo The tests look like this:

This is essentially a unit test and the intention in Rust is that the unit tests sit next to the functions which they test, in Python unit tests tend to be separated into tests directory. In a Rust project the tests directory holds integration tests. There is a third type of test, doctests which are embedded in the comments intended for documentation.

All three types of test can be run with cargo test.

The built-in test functionality does not include features such as mocks or parameterized tests but there are third party crates to provide this functionality.

Static analysis and formatting tools

Clippy is the built-in linter, used in addition to rustfmt, the formatter. The are invoked using cargo with cargo fmt and cargo clippy. As a compiled language the compiler provides static analysis too. I would not expect alternatives to clippy or rustfmt to gain much traction since these appear to be the “official” tools.

Documentation Generation

rustdoc is the standard documentation generator tool (see here), working from comments in code and invoked using cargo doc. It feels to me that there is scope for alternatives to rustdoc although perhaps I am mixing up the documentation generation engine with the standards for code comments for documentation which have arisen in Python.

Wrapping up

I was struck by how everything is pretty much built-in for Rust; compiling, packaging, testing, formatting, and linting. All of these tools can be driven from the package management tool, cargo. It is almost like the design team was trying to make the job of writing this post as easy as possible! In writing Rust code in associated with this post I found the built-in test framework missing features (like mocks and parameterization which I’m used to in Python), similarly the documentation system is quite simple so perhaps in time alternatives will start to predominate.

My “home” language of Python has acquired these features over a long period of time, utilizing third party libraries and tools that eventually became de facto standards.

It would be nice to make a comparison with Go which occupies a similar space in programming as a relatively recent arrival with what I believe is a similarly full tool suite.

I welcome comments, probably best on Mastodon where you can find me here.