Tag: scraper

Revisions to UK GDP data

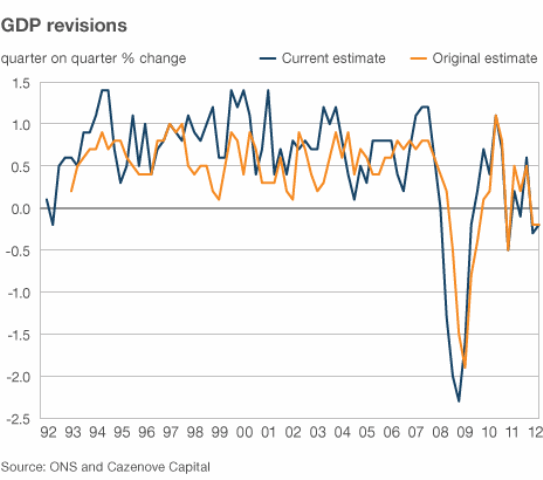
The BBC published an article entitled “Viewpoint: Is UK GDP data fit for purpose?” which featured a graph showing the original estimates for quarterly UK GDP growth and current estimates for those same figures. The point being that the original figures are subject to revision which can change figures quite significantly, for example currently we are technically in recession with a GDP growth figure for Q1 2012 of –0.2% (source). But how does this compare with the size of the revisions made to the data?

Here is the graph from the original article:

464

This is quite nice but there are other ways to display this data, which unfortunately isn’t linked directly to the graph. However, this should not stop an enterprising number-cruncher, there exists software which will allow you to extract the numbers from graphs! I used Engauge Digitizer, which worked fine for me – I had the data I wanted 20 minutes or so after I’d downloaded the software. It does some semi-automatic extraction which makes separating the two different sets of data in the graph on the basis of the colour of the lines quite easy.

This type of approach is not ideal, the sampling interval for the extracted data is not uniform, and not the same for the two datasets, furthermore the labelling of the x-axis is unclear so it’s difficult to tell exactly which quarter is referred to.

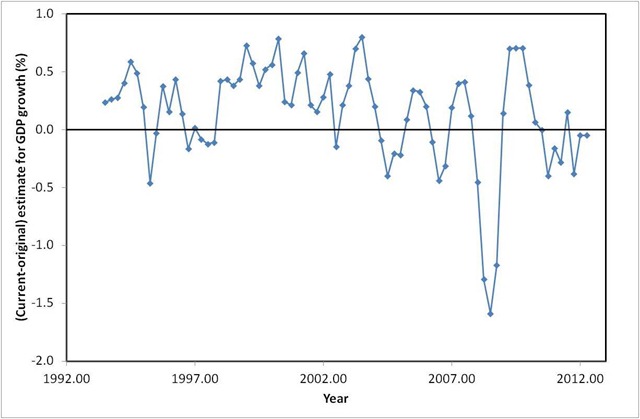
I next loaded up the data into Excel for a bit of quick and easy plotting. To address the sampling problem I used the vlookup function to give me data for each series on a quarterly basis. I can then plot interesting things like the difference between the current and original estimates for each quarter, as shown below:

DifferenceGraph

A few spot checks referring back to the original chart can convince us that we have scraped the original data moderately well. The data also fit with the ONS comment on the article:

…looking back over the last 20 quarters, between the first and most recent estimates, the absolute revision (that is, ignoring the +/- sign) is still only 0.4 percentage points.

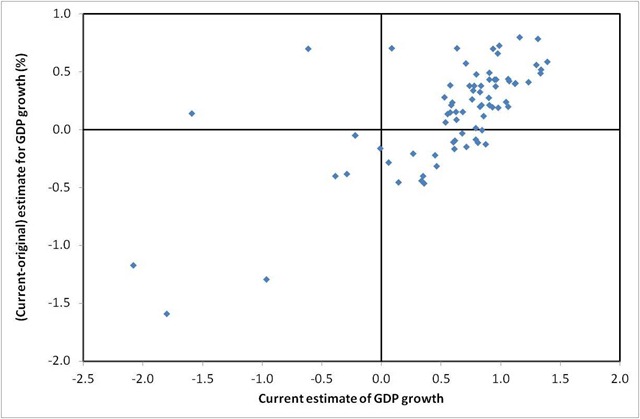
I calculated this revision average and got roughly the same result.We can also plot the size of revisions made as a function of the current estimate of the GDP growth figure:

DifferenceGraph2

This suggests that as the current estimate of growth goes up so does the size of the revision: rises are under-estimated, falls in growth are under-estimated in the first instance although this is not a statistically strong relationship. These quarterly figures on GDP growth seem awfully noisy, which perhaps explains some of the wacky explanations for them (snow, weddings, hot weather etc etc) – they’re wild stabs at trying to explain dodgy data which doesn’t actually have an explanation.

The thing is that the “only 0.4 percentage points” that the ONS cites makes all the difference between being in recession and not being in recession!

Footnotes

I uploaded my spreadsheet here, the figures did not import well.

House of Lords register of members interests

This post is about the House of Lords register of members interests, an online resource which describes the financial and other interests of members of the UK House of Lords. This follows on from earlier posts on the attendance rates of Lords, it turns out 20% of them only turn up twice a year. I also wrote a post on the political  breakdown of the House and the number of appointments to it in each year over the period since the mid-1970s. This is all of current interest since reform is in the air for the House of Lords, on which subject I made a short post.

I was curious to know the occupations of the Lords, there is no direct record of occupations but the register of members interests provides a guide. The members interests are divided into categories, described in this document and summarised below:

Category 1 Directorships
Category 2 Remunerated employment, office, profession etc.
Category 3 Public affairs advice and services to clients
Category 4a Controlling shareholding
Category 4b Not a controlling shareholding but exceeding £50,000
Category 5 Land and property, capital value exceeding £250,000 or income exceeding £5,000 but not main residence
Category 6 Sponsorship
Category 7 Overseas visits
Category 8 Gifts, benefits and hospitality
Category 9 Miscellaneous financial interests
Category 10a Un-renumerated directorship or employment
Category 10b Membership of public bodies, (hospital trusts, governing bodies etc)
Category 10c Trusteeships of galleries, museums and so forth
Category 10d Officer or trustee of a pressure group or union
Category 10e Officer or trustee of a voluntary or not-for-profit organisation


The values of these interests are not listed but typically the threshold value for inclusion is £500 except where stated.

The data are provided as webpages, with one page per initial letter there are no Lords whose Lord Name starts with X or Z. This is a bit awkward for carrying out analysis so I wrote a program in Python which reads the webpages using the BeautifulSoup HTML/XML parser and converts them into a single Comma Separated Value (CSV) file where each row corresponded to a single category entry for a single Lord – this is the most useful format for subsequent analysis.

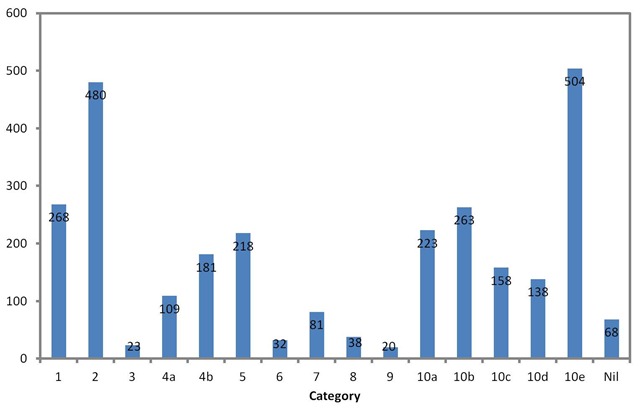
The data contains entries for 828 Lords, which translates into 2821 entries in the big table. The chart below shows the number of entries for each category.


CategoryBreakdown

This breaks things down into more manageable chunks. I quite like the miscellaneous category 9, where people declare their spouses if they are also members of the House and Lord Edmiston who declares “Occasional income from the hiring of Member’s plane”. Those that declare no interests are split between “on leave of absence”, “no registrable interests”, “there are no interests for this peer” and “information not yet received”. The sponsorship category (6) is fairly dull, typically secretarial support from other roles.

Their Lordships are in great demand as officers and trustees of non-profits and charities, as indicated by category 10e, and as members on the boards of public bodies (category 10b).

I had hoped that category 2 would give me some feel for occupations of Lords, I was hoping to learn something of the skills distribution since it’s often claimed that the way in which they are appointed means they bring a wide range of expertise to bear. Below I show a wordle of the category 2 text.Wordle of category 2 interests textThere’s a lot of speaking and board membership going on unfortunately it’s not easy to pull occupations out of the data. I can’t help but get the impression that the breakdown of the Lords is not that dissimilar to that of the Commons, indeed many Lords are former MPs – this means lots of lawyers.

You can download the data in the form of a single file from Google Docs here. I’ve added an index column and the length of the text for each entry. Viewing as a single file in this compact format is easier than the original pages and you can do interesting things such as sort by different columns or search the entire file for keywords (professor, Tesco, BBC… etc). The Python program I wrote is here.

The House of Lords by numbers

Reform is in the air for the House of Lords, to be fair reform has been in the air for large parts of the last hundred years. Currently reform comes in the form of a proposal put forward by Nick Clegg and backed by David Cameron – you can see the details here. It comes in the context of all three main Westminster parties supporting a largely elected House of Lords in their 2010 General Election manifestos.

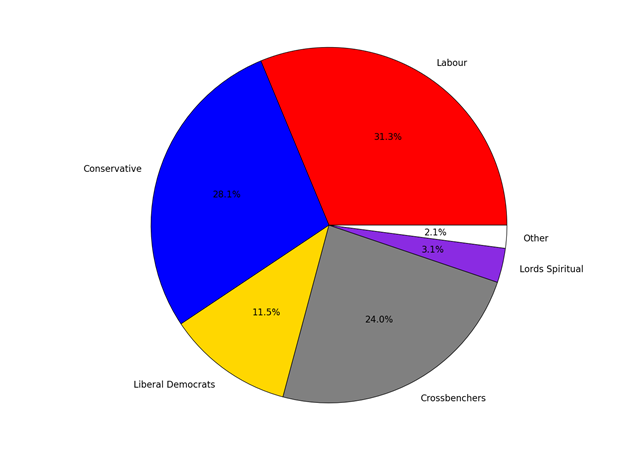
The purpose of this post is not to go through the proposals in detail but simply to provide some charts on appointments to the House of Lords over the years. The current composition of the House is shown in the pie-chart below:

CurrentComposition

The membership of the House of Lords currently numbers 789, I have excluded the handful of members from UKIP, DUP, UUP, the Greens and Plaid Cymru since they are too few to show up in such a chart.

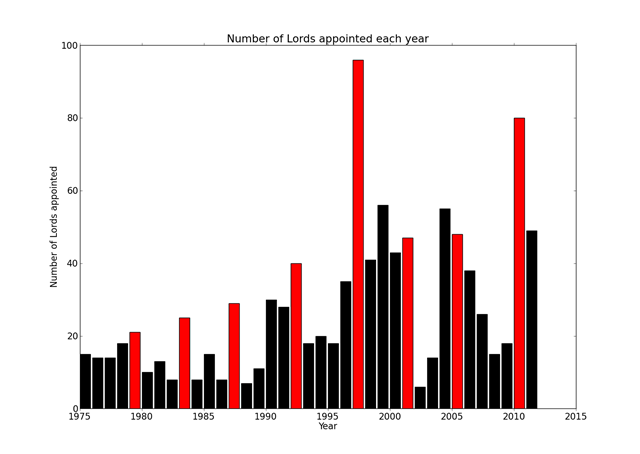
The website www.theyworkforyou.com provides a handy list of peers in an easily readable format, this list includes data such as when they were appointed, what party they belong to, what name they have chosen and when they left and whether they used to be an MP. We can plot the number of appointments each year:HoLTotalByYear

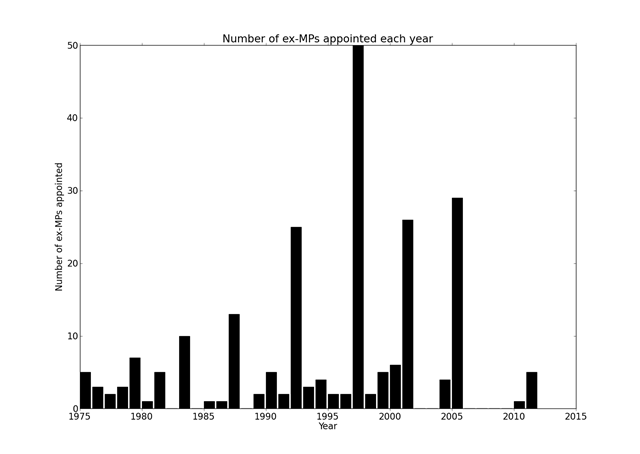
I’ve highlighted election years in red, as you can see election years are popular for the appointment of new members, and it would seem many of those appointed in such years are former MPs, as shown in the graph below:

HoLexMPs

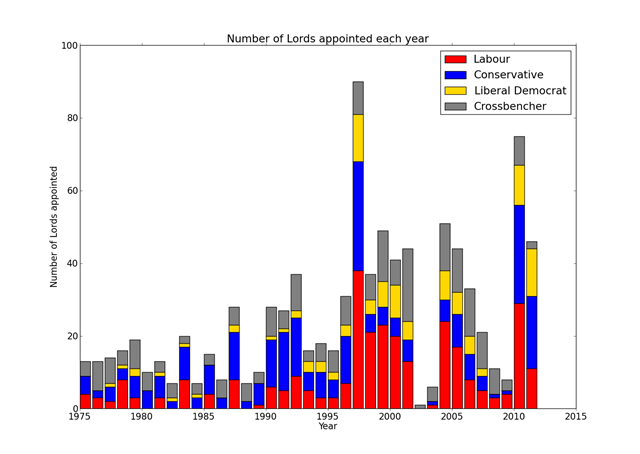
But to which parties do these appointees belong? This question is answered below:

HoLTotalByYearAndParty

I hope this provides a useful backdrop to subsequent discussions on reform.

More news from the shed…

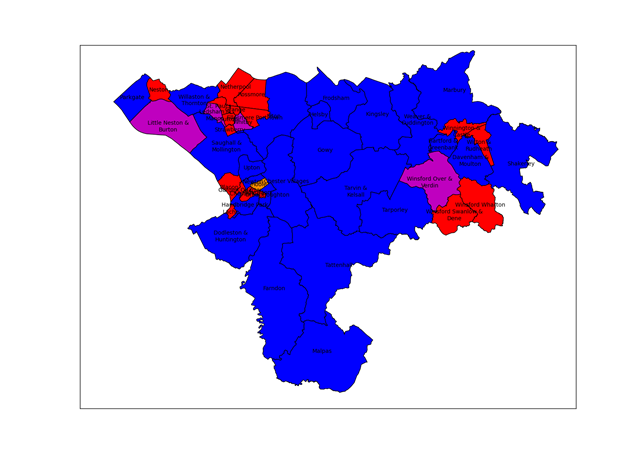
CWACResults2011

In the month of May I seem to find myself playing with maps and numbers.

To the uninvolved this may appear to be rather similar to my earlier “That’s nice dear”, however the technology involved here is quite different.

This post is about extracting the results from the local elections held on 5th May from the Cheshire West and Chester website and displaying them as a map. I could have manually transcribed the results from the website, this would probably be quicker, but where’s the fun in that?

The starting point for this exercise was noticing that the results pages have a little icon at the bottom saying “OpenElectionData”. This was part of an exercise to make local election results more easily machine-readable in order to build a database of results from across the country, somewhat surprisingly there is no public central record of local council election results. The technology used to provide machine access to the results is known as RDF (standing for Resource Description Framework), this is a way of providing “meaning” to web pages for machines to understand – this is related to the talk of the semantic web. The good folks at Southampton University have provided a browser which allows you to inspect the RDF contents of a webpage. I used this to get a human sight of the data I was trying to read.

RDF content ultimately amounts to triplets of information: “subject”,”predicate”,”object”. In the case of an election then one triplet has a subject of “specific ward identifier” the predicate is “a list of candidates” and the object is “candidate 1;candidate 2; candidate 3…”. Further triplets specify the whether a candidate was elected, how many votes they received and the party to which they belong.

I’ve taken to programming in Python recently, in particular using the Python(x,y) distribution which packages together an IDE with some libraries useful to scientists. This is the sort of thing I’d usually do with Matlab, but that costs (a lot) and I no longer have access to it at home.

There is a Python library for reading RDF data, called RDFlib, unfortunately most of the documentation is for version 2.4 and the working version which I downloaded is 3.0. Searching for documentation for the newer version normally leads to other sites where people are asking where the documentation is for version 3.0!

The base maps come from the Ordnance Survey, specifically the Boundary Line dataset which contains administrative boundary data for the UK in ESRI Shapefile format. This format is widely used for geographical information work, I found the PyShp library from GeospatialPython.com to be well-documented and straightforward way to read the format. The site also has some nice usage examples. I did look for a library to display the resulting maps but after a brief search I adapted the simple methods here for drawing maps using matlibplot.

The Ordnance Survey Open Data site is a treasure trove for programming cartophiles, along with maps of the UK of various types there’s a gazetteer of interesting places, topographic information and location data for UK postcode.

The map at the top of the page uses the traditional colour-coding of red for Labour and blue for Conservative, some wards elect multiple candidates and in those where the elected councillors are not all from the same party purple is used to show a Labour/Conservative combination and orange a Labour/Liberal Democrat combination.

In contrast to my earlier post on programming, the key elements here are the use of pre-existing libraries and data formats to achieve an end result. The RDF component of the exercise took quite a while, whilst the mapping part was the work of a couple of hours. This largely comes down to the quality of the documentation available. Python turns out to be a compact language to do this sort of work, it’s all done in 150 or so lines of code.

It would have been nice to have pointed my program to a single webpage and for it to find all the ward data from there, including the ward names, but I couldn’t work out how to do this – the program visits each ward in turn and I had to type in the ward names. The OpenElectionData site seemed to be a bit wobbly too, so I encoded party information into my program rather the pulling it from their site. Better fitting of the ward labels into the wards would have been nice too (although this is a hard problem). Obviously there’s a wide range of analysis that can be carried out on the underlying electoral data.

Footnotes

The python code to do this analysis is here. You will need to install the rdflib and PyShp libraries and download the OS Boundary Line data. I used the Python(x,y) distribution but I think it’s just the matlibplot library which is required. The CWac.py program extracts the results from the website and writes them to a CSV file, the Mapping.py program makes a map from them. You will need to adjust file paths to suit your installation.

Obsession

This is a short story about obsession: with a map, four books and some numbers.

My last blog post was on Ken Alder’s book “The Measure of All Things” on the surveying of the meridian across France, through Paris, in order to provide a definition for a new unit of measure, the metre, during the period of the French Revolution. Reading this book I noticed lots of place names being mentioned, and indeed the core of the whole process of surveying is turning up at places and measuring the angles to other places in a process of triangulation.

To me places imply maps, and whilst I was reading I popped a few of the places into Google Maps but this was unsatisfactory to me. Delambre and Mechain, the surveyors of the meridian, had been to many places. I wanted to see where they all were. Ken Alder has gone a little way towards this in providing a map: you can see it on his website but it’s an unsatisfying thing: very few of the places are named and you can’t zoom into it.

In my investigations for the last blog post, I discovered the full text of the report of the surveying mission, “Base du système métrique décimal”, was available online and flicking through it I found a table of all 115 triangles used in determining the meridian. So a plan is formed: enter the names of the stations forming the 115 triangles into a three column spreadsheet; determine the latitude and longitude of each of these stations using the Google Maps API; write these locations out into a KML file which can be viewed in Google Maps or Google Earth.

The problem is that place names are not unique and things have changed in the last 200 years. I have spent hours transcribing the tables and hunting down names of obscure places in rural France, hacking away with Python and loved every minute of it. Cassini’s earlier map of France is available online but the navigation is rather clumsy so I didn’t use it. Although now I come to writing this I see someone else has made a better job of it.

Beside three entries in the tables of triangles are the words: “Ce triangle est inutile” – “This triangle is useless”. Instantly I have a direct bond with Delambre, who wrote those words 200 years ago –  I know that feeling: in my loft is a sequence of about 20 lab books I used through my academic career and I know that besides an (unfortunately large) number of results the word “Bollocks!” is scrawled for very similar reasons.

The scheme with the the Google Maps API is that your program provides a place name “Chester, UK”, for example, and the API provides you with the latitude and longitude of the point requested. Sometimes this doesn’t work, either because there are several places with the same name or the placename is not in the database.

I did have a genuine Eureka moment: after several hours trying to find missing places on the map I had a bath and whilst there I had an idea: Google Earth supports overlay images on its maps. At the back of the “Base du système métrique décimal” there is a set of images showing where the stations are as a set of simple line diagrams. Surely I could overlay the images from Base onto Google Earth and find the missing stations? I didn’t leap straight from the bath, but I did stay up overlaying images onto maps deep into the night. It turns out the diagrams are not at all bad for finding missing stations. This manual fiddling to sort out errant stations is intellectually unsatisfying but some things it’s just quicker to do by hand!

You can see the results of my fiddling by loading this KML file into Google Earth, if you’re really keen this is a zip file containing the image overlays from “Base du système métrique décimal” – they match up pretty well given they are photocopies of diagrams subject to limitations in the original drawing and distortion by scanning.

What have I learned in this process?

  • I’ve learnt that although it’s possible to make dictionaries of dictionaries in Python it is not straightforward to pickle them.
  • I’ve enjoyed exploring the quiet corners of France on Google Maps
  • I’ve had a bit more practice using OneNote, Paint .Net, Python and Google Earth so when the next interesting thing comes along I’ll have a head start.
  • Handling French accents in Python is a bit beyond my wrangling skills.

You’ve hopefully learnt something of the immutable mind of a scientist!
View