Tag: scraperwiki

Book review: Natural Language Processing with Python by Steven Bird, Ewan Klein & Edward Loper

natural-language-processing-with-python

This post was first published at ScraperWiki.

I bought Natural Language Processing in Python by Steven Bird, Ewan Klein & Edward Loper for a couple of reasons. Firstly, ScraperWiki are part of the EU Newsreader Project which seeks to make a “history recorder” using natural language processing to convert large streams of news articles into a more structured form. ScraperWiki’s role in this project is to scrape open sources of news related material, such as parliamentary records and to drive exploitation of the results of this work both commercially and through our contacts in the open source community. Although we’re not directly involved in the natural language processing work it seems useful to get a better understanding of the area.

Secondly, I’ve recently given a talk at Data Science London, and my original interpretation of the brief was that I should talk a bit about natural language processing. I know little of this subject so thought I should read up on it, as it turned out no natural language processing was required on my part.

This is the book of the Natural Language Toolkit Python library which contains a wide range of linguistic resources, methods for processing those resources, methods for accessing new resources and small applications to give a user-friendly interface for various features. In this context “resources” mean the full text of various books, corpora(large collections of text which have been marked up to varying degrees with grammatical and other data) and lexicons (dictionaries and the like).

Natural Language Processing is didactic, it is intended as a text for undergraduates with extensive exercises at the end of each chapter. As well as teaching the fundamentals of natural language processing it also seeks to teach readers Python. I found this second theme quite useful, I’ve been programming in Python for quite some time but my default style is FORTRANIC. The authors are a little scornful of this approach, they present some code I would have been entirely happy to write and describe it as little better than machine code! Their presentation of Python starts with list comprehensions which is unconventional, but goes on to cover the language more widely.

The natural language processing side of the book progresses from the smallest language structures (the structure of words), to part of speech labeling, phrases to sentences and ultimately deriving logical statements from natural language.

Perhaps surprisingly tokenization and segmentation, the process of dividing text into words and sentences respectively is not trivial. For example acronyms may contain full stops which are not sentence terminators. Less surprisingly part of speech (POS) tagging (i.e. as verb, noun, adjective etc) is more complex since words become different parts of speech in different contexts. Even experts sometimes struggle with parts of speech labeling. The process of chunking – identifying noun and verb phrases is of a similar character.

Both chunking and part of speech labeling are tasks which can be handled by machine learning. The zero order POS labeller assumes everything is a noun, the next simplest method is a simple majority voting one which takes the POS tag for previous word(s) and assumes the most frequent tag for the current word based on an already labelled body of text. Beyond this are the machine learning algorithms which take feature sets, including the tags of neighbouring words, to provide a best estimate of the tag for the word of interest. These algorithms include Bayesian classifiers, decision trees and the like, as discussed in Machine Learning in Action which I have previously reviewed. Natural Language Processing covers these topics fairly briefly but provides pointers to take things further, in particular highlighting that for performance reasons one may use external libraries from the Natural Language Toolkit library.

The final few chapters on context free grammars exceeded the limits of my understanding for casual reading, although the toy example of using grammars to translate natural language queries to SQL clarified the intention of these grammars for me. The book also provides pointers to additional material, and to where the limits of the field of natural language processing lie.

I enjoyed this book and recommend it, it’s well written with a style which is just the right level of formality. I read it on the train so didn’t try out as many of the code examples as I would have liked – more of this in future. You don’t have to buy this book, it is available online in its entirety but I think it is well worth the money.

Book review: Interactive Data Visualization for the web by Scott Murray

interactivevisualisation

This post was first published at ScraperWiki.

Next in my book reading, I turn to Interactive Data Visualisation for the web by Scott Murray (@alignedleft on twitter). This book covers the d3 JavaScript library for data visualisation, written by Mike Bostock who was also responsible for the Protovis library.  If you’d like a taster of the book’s content, a number of the examples can also be found on the author’s website.

The book is largely aimed at web designers who are looking to include interactive data visualisations in their work. It includes some introductory material on JavaScript, HTML, and CSS, so has some value for programmers moving into web visualisation. I quite liked the repetition of this relatively basic material, and the conceptual introduction to the d3 library.

I found the book rather slow: on page 197 – approaching the final fifth of the book – we were still making a bar chart. A smaller effort was expended in that period on scatter graphs. As a data scientist, I expect to have several dozen plot types in that number of pages! This is something of which Scott warns us, though. d3 is a visualisation framework built for explanatory presentation (i.e. you know the story you want to tell) rather than being an exploratory tool (i.e. you want to find out about your data). To be clear: this “slowness” is not a fault of the book, rather a disjunction between the book and my expectations.

From a technical point of view, d3 works by binding data to elements in the DOM for a webpage. It’s possible to do this for any element type, but practically speaking only Scaleable Vector Graphics (SVG) elements make real sense. This restriction means that d3 will only work for more recent browsers. This may be a possible problem for those trapped in some corporate environments. The library contains a lot of helper functions for generating scales, loading up data, selecting and modifying elements, animation and so forth. d3 is low-level library; there is no PlotBarChart function.

Achieving the static effects demonstrated in this book using other tools such as R, Matlab, or Python would be a relatively straightforward task. The animations, transitions and interactivity would be more difficult to do. More widely, the d3 library supports the creation of hierarchical visualisations which I would struggle to create using other tools.

This book is quite a basic introduction, you can get a much better overview of what is possible with d3 by looking at the API documentation and the Gallery. Scott lists quite a few other resources including a wide range for the d3 library itself, systems built on d3, and alternatives for d3 if it were not the library you were looking for.

I can see myself using d3 in the future, perhaps not for building generic tools but for custom visualisations where the data is known and the aim is to best explain that data. Scott quotes Ben Schniederman on this regarding the structure of such visualisations:

overview first, zoom and filter, then details on demand

Book review: JavaScript: The Good Parts by Douglas Crockford

javascriptthegoodparts1

This post was first published at ScraperWiki.

This week I’ve been programming in JavaScript, something of a novelty for me. Jealous of the Dear Leader’s automatically summarize tool I wanted to make something myself, hopefully a future post will describe my timeline visualising tool. Further motivations are that web scraping requires some knowledge of JavaScript since it is a key browser technology and, in its prototypical state, the ScraperWiki platform sometimes requires you to launch a console and type in JavaScript to do stuff.

I have two books on JavaScript, the one I review here is JavaScript: The Good Parts by Douglas Crockford – a slim volume which tersely describes what the author feels the best bits of JavaScript, incidently highlighting the bad bits. The second book is the JavaScript Bible by Danny Goodman, Michael Morrison, Paul Novitski, Tia Gustaff Rayl which I bought some time ago, impressed by its sheer bulk but which I am unlikely ever to read let alone review!

Learning new programming languages is easy in some senses: it’s generally straightforward to get something to happen simply because core syntax is common across many languages. The only seriously different language I’ve used is Haskell. The difficulty with programming languages is idiom, the parallel is with human languages: the barrier to making yourself understood in a language is low, but to speak fluently and elegantly needs a higher level of understanding which isn’t simply captured in grammar. Programming languages are by their nature flexible so it’s quite possible to write one in the style of another – whether you should do this is another question.

My first programming language was BASIC, I suspect I speak all other computer languages with a distinct BASIC accent. As an aside, Edsger Dijkstra has said:

[…] the teaching of BASIC should be rated as a criminal offence: it mutilates the mind beyond recovery.

– so perhaps there is no hope for me.

JavaScript has always felt to me a toy language: it originates in a web browser and relies on HTML to import libraries but nowadays it is available on servers in the form of node.js, has a wide range of mature libraries and is very widely used. So perhaps my prejudices are wrong.

The central idea of JavaScript: The Good Parts is to present an ideal subset of the language, the Good Parts, and ignore the less good parts. The particular bad parts of which I was glad to be warned:

  1. JavaScript arrays aren’t proper arrays with array-like performance, they are weird dictionaries;
  2. variables have function not block scope;
  3. unless declared inside a function variables have global scope;
  4. there is a difference between the equality == and === (and similarly the inequality operators). The short one coerces and then compares, the longer one does not, and is thus preferred. 

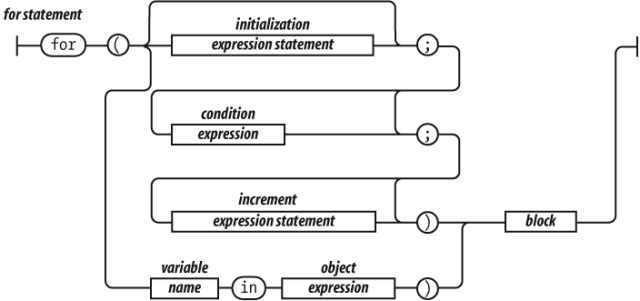
I liked the railroad presentation of syntax and the section on regular expressions is good too.

railroadsyntaxdiagramfor

Elsewhere Crockford has spoken approvingly of CoffeeScript which compiles to JavaScript but is arguably syntactically nicer, it appears to hide some of the bad parts of JavaScript which Crockford identifies.

If you are new to JavaScript but not to programming then this is a good book which will give you a fine start and warn you of some pitfalls. You should be aware that you are reading about Crockford’s ideal not the code you will find in the wild.

Book review: R in Action by Peter Harrington

rinaction

This post was first published at ScraperWiki.

This is a review of Robert I. Kabacoff’s book R in Action which is a guided tour around the statistical computing package, R.

My reasons for reading this book were two-fold: firstly, I’m interested in using R for statistical analysis and visualisation. Previously I’ve used Matlab for this type of work, but R is growing in importance in the data science and statistics communities; and it is a better fit for the ScraperWiki platform. Secondly, I feel the need to learn more statistics. As a physicist my exposure to statistics is relatively slight  –  I’ve wondered why this is the case and I’m eager to learn more.

In both cases I see this book as an atlas for the area rather than an A-Z streetmap. I’m looking to find out what is possible and where to learn more rather than necessarily finding the detail in this book.

R in Action follows a logical sequence of steps for importing, managing, analysing, and visualising data for some example cases. It introduces the fundamental mindset of R, in terms of syntax and concepts. Central of these is the data frame  –  a concept carried over from other statistical analysis packages. A data frame is a collection of variables which may have different types (continuous, categorical, character). The variables form the columns in a structure which looks like a matrix  –  the rows are known as observations. A simple data frame would contain the height, weight, name and gender of a set of people. R has extensive facilities for manipulating and reorganising data frames (I particularly like the sound of melt in the reshape library).

R also has some syntactic quirks. For example, the dot (.) character, often used as a structure accessor in other languages, is just another character as far as R is concerned. The $ character fulfills a structure accessor-like role. Kabacoff sticks with the R user’s affection for using <- as the assignment operator instead of = which is what everyone else uses, and appears to work perfectly well in R.

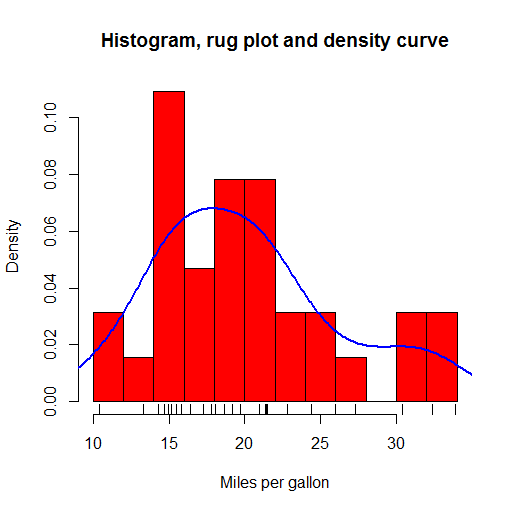
R offers a huge range of plot types out-of-the-box, with many more a package-install away (and installing packages is a trivial affair). Plots in the base package are workman-like but not the most beautiful. I liked the kernel density plots which give smoothed approximations to histogram plots and the rug plots which put little ticks on the axes to show where the data in the body of that plot fall. These are all shown in the plot below, plotted from example data included in R.

histogramrugdensityplot

The ggplot2 package provides rather more beautiful plots and seems to be the choice for more serious users of R.

The statistical parts of the book cover regression, power analysis, methods for handling missing data, group comparison methods (t-tests and ANOVA), and principle component and factor analysis, permutation and bootstrap methods. I found it a really useful survey  –  enough to get the gist and understand the principles with pointers to more in-depth information.

One theme running through the book, is that there are multiple ways of doing almost anything in R, as a result of its rich package ecosystem. This comes to something of a head with graphics in the final section: there are 4 different graphics systems with overlapping functionality but different syntax. This collides a little with the Matlab way of doing things where there is the one true path provided by Matlab alongside a fairly good, but less integrated, ecosystem of user-provided functionality.

R is really nice for this example-based approach because the base distribution includes many sample data sets with which to play. In addition, add-on packages often include sample data sets on which to experiment with the tools they provide. The code used in the book is all relatively short; the emphasis is on the data and analysis of the data rather than trying to build larger software objects. You can do an awful lot in a few lines of R.

As an answer to my statistical questions: it turns out that physics tends to focus on Gaussian-distributed, continuous variables, while statistics does not share this focus. Statistics is more generally interested in both categorical and continuous variables, and distributions cannot be assumed. For a physicist, experiments are designed where most variables are fixed, and the response of the system is measured as just one or two variables. Furthermore, there is typically a physical theory with which the data are fitted, rather than a need to derive an empirical model. These features mean that a physicist’s exposure to statistical methods is quite narrow.

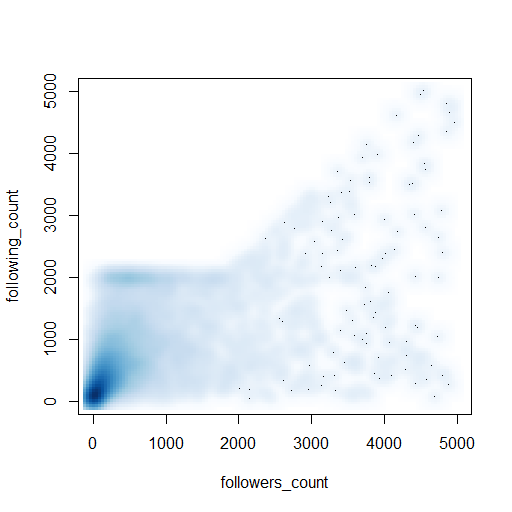
Ultimately I don’t learn how to code by reading a book, I learn by solving a problem using the new tool  –  this is work in progress for me and R, so watch this space! As a taster, just half a dozen lines of code produced the appealing visualisation of twitter profiles shown below:

smoothscattertwitterfollow

(Here’s the code: https://gist.github.com/IanHopkinson/5318354)

Book review: Machine Learning in Action by Peter Harrington

machinelearningcover

This post was first published at ScraperWiki.

Machine learning is about prediction, and prediction is a valuable commodity. This sounds pretty cool and definitely the sort of thing a data scientist should be into, so I picked up Machine Learning in Action by Peter Harrington to get an overview of the area.

Amongst the examples covered in this book are:

  • Given that a customer bought these items, what other items are they likely to want?
  • Is my horse likely to die from colic given these symptoms?
  • Is this email spam?
  • Given that these representatives have voted this way in the past, how will they vote in future?

In order to make a prediction, machine learning algorithms take a set of features and a target for a training set of examples. Once the algorithm has been trained, it can take new feature sets and make predictions based on them. Let’s take a concrete example: if we were classifying birds, the birds’ features would include the weight, size, colour and so forth and the target would be the species. We would train the algorithm on an initial set of birds where we knew the species, then we would measure the features of unknown birds and submit these to the algorithm for classification.

In this case, because we know the target – a species of bird – the algorithms we use would be referred to as “supervised learning.” This contrasts “unsupervised learning,” where the target is unknown and the algorithm is seeking to make its own classification. This would be equivalent to the algorithm creating species of birds by clustering those with similar features. Classification is the prediction of categories (i.e. eye colour, like/dislike), alternatively regression is used to predict the value of continuous variables (i.e. height, weight).

Machine learning in Action is divided into four sections that cover key elements and “additional tools” which includes algorithms for dimension reduction and MapReduce – a framework for parallelisation. Dimension reduction is the process of identifying which features (or combination of features) are essential to a problem.

Each section includes Python code that implements the algorithms under discussion and these are applied to some toy problems. This gives the book the air of Numerical Recipes in FORTRAN, which is where I cut my teeth on numerical analysis. The mixture of code and prose is excellent for understanding exactly how an algorithm works, but its better to use a library implementation in real life.

The algorithms covered are:

  • Classification – k-Nearest Neighbours, decision trees, naive Bayes, logistic regression, support vector machines, and AdaBoost;
  • Regression – linear regression, locally weighted linear regression, ridge regression, tree-based regression;
  • Unsupervised learning – k-means clustering, apriori algorithm, FP-growth;
  • Additional tools – principle component analysis and singular value decomposition.

Prerequisites for this book are relatively high: it assumes fair Python knowledge, some calculus, probability theory and matrix algebra.

I’ve seen a lot of mention of MapReduce without being clear what it was. Now I am more clear: it is a simple framework for carrying out parallel computation. Parallel computing has been around quite some time, the problem has always been designing algorithms that accommodate parallelisation (i.e. allow problems to be broken up into pieces which can be solved separately and then recombined). MapReduce doesn’t solve this problem but gives a recipe for what is required to run on commodity compute cluster.

As Harrington says: do you need to run MapReduce on a cluster to solve your data problem? Unless you are an operation on the scale of Google or Facebook then probably not. Current, commodity desktop hardware is surprisingly powerful particularly when coupled with subtle algorithms.

This book works better as an eBook than paper partly because the paper version is black and white and some figures require colour but the programming listings are often images and so the text remains small.