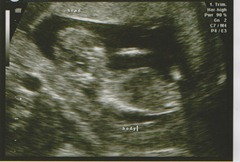
 Alert readers will remember that I am in the process of becoming a father, and that the occasion of this announcement was the "dating scan" (Codename Beetle). In the UK, at least, this is an ultrasound scan targeted to take place at about 12 weeks pregnancy with a view to getting a more precise estimate of birth date from the size of the fetus, measured from “crown” to “rump”. Alongside this a nuchal fold measurement may be made to help test for Down’s Syndrome, it turns out this requires a cooperative fetus willing to assume just the right posture, Beetle wasn’t!
From a scientific point of view this is all really interesting: you can see inside people! In this instance, my wife.
The inside of a human is largely squidgy but different parts have different squidginess, in particular there is a nice contrast between the muscular wall of the womb and the liquid contents and again between the liquid contents of the womb and the fetus. Ultrasound is reflected when there are interfaces between things of different squidginess. There’s a direct analogy between this squidginess and the “impedance” of electrical components in things like hifi equipment, and the transmission of sound waves and the transmission of radio waves.
The scan starts off with the operator squirting generous quantities of lubricant onto the wife’s belly (in a hospital environment this gives me flashbacks to the Unexpected Prostate Examination Incident). The lubricant is to give good “impedance matching” between the ultrasound scanner and the swollen belly of the wife, without it the sound bouncing off the skin surface would be all you heard.
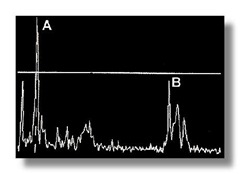
To build up an ultrasound image we listen for echoes. The ultrasound probe lets out a squeak and waits for echoes, the time taken for the echo to arrive tells you how far away the thing that created the echo. This is really obvious in the earliest ultrasound devices which worked in what is know as “A-mode”: sending out a single beam of sound in one direction and recording the sound that came back as a function of time. Typical data* shown below.
The echo marked A represents a structure closer to the surface than the echo marked B.
You can build up a proper image by scanning your beam of sound backwards and forwards to map out a fan, this is known as “B-mode” and is the type of imaging you will be most familiar with, the image at the top of the page is an example. It shows a vertical fan-shaped slice into the body, with features at the bottom of the scan further from the surface than those at the top.
In the old days moving the beam backwards and forwards was a mechanical process but modern scanners do it electronically with no moving parts. This is done with a “phased array” similar to those used in radar systems; a line of transmitters is fed signals with different phases (the sinusoidal sound waves are offset in time by different amounts) the result of this is a sound beam that can be steered backwards and forwards without physically moving any parts.
 These days you can even get “4D” scans done. These use a square (2D) array of emitters to scan rapidly over an area, getting the third dimensions from the echo time and a fourth (time) dimension by being able to repeat the process rapidly. These scans are converted to a moving 3D surface (or “baby”) by thresholding the 3D data set and using computer graphics techniques to produce nice graphics. I must admit I find these images a bit creepy (the one on the right is not Beetle). Given my experience of image analysis, extracting a neat surface from the noisy data, in real time, is pretty tricky.
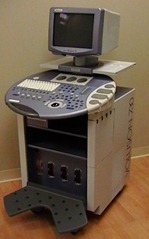 If I’d been paying attention I could probably have read the name of the particular ultrasound scanner used on my wife, but I had other things on my mind. As it was I could identify it because there’s an interesting looking coding on the sonograph (RAB-4-8L/0B) which turns out to be the serial number of a detector for the General Electric Voluson 730 devices. A quick bit of googling reveals a convincing looking image of the scanner, they cost something in the range £20k-£40k.
Ultrasound imaging utilises sound in the frequency range 2-18MHz although for the probe used for Mrs S’s scan the range is 4-8MHz wavelengths for such waves are 0.2-0.3mm which will be the maximum achievable spatial resolution. The lowest of these ultrasound frequencies is 100 times higher than the upper limit of human hearing at 20kHz, and 10 times higher than those used by bats and dolphins.
The velocity of sound waves in water is 1540m/s, for the purposes of this calculation humans are approximately water, the raster rate (speed at which the sound beam goes backwards and forwards) appears to have been 18Hz or once every 1/18th of a second). Given the speed of sound in Mrs S, we could actually image many metres into her – if required. This suggests that the speed sound is not a limiting factor in how fast we can do scans: the noise in the signal is the limiting factor. That’s to say the strength of the echoes we get back is rather weak and looking at the images they are mixed with a lot of noise.
Ultrasound machines are really rather high technology bits of kit, containing lots of interesting physics. I must admit having read up a bit – I want one to play with!
*”Typical data”, in scientific terms means “I’m going to claim this is typical but actually this is the best we collected”.

