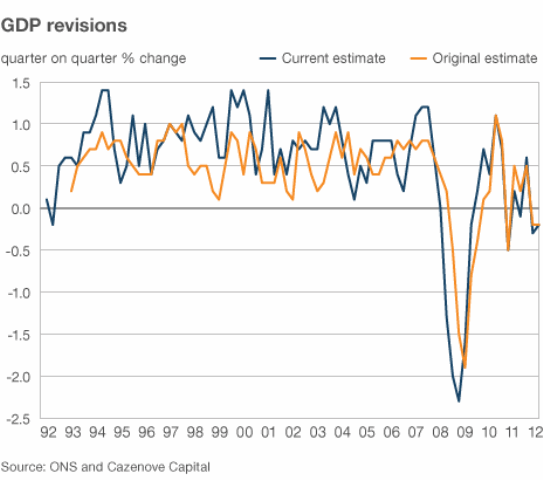
The BBC published an article entitled “Viewpoint: Is UK GDP data fit for purpose?” which featured a graph showing the original estimates for quarterly UK GDP growth and current estimates for those same figures. The point being that the original figures are subject to revision which can change figures quite significantly, for example currently we are technically in recession with a GDP growth figure for Q1 2012 of –0.2% (source). But how does this compare with the size of the revisions made to the data?
Here is the graph from the original article:
This is quite nice but there are other ways to display this data, which unfortunately isn’t linked directly to the graph. However, this should not stop an enterprising number-cruncher, there exists software which will allow you to extract the numbers from graphs! I used Engauge Digitizer, which worked fine for me – I had the data I wanted 20 minutes or so after I’d downloaded the software. It does some semi-automatic extraction which makes separating the two different sets of data in the graph on the basis of the colour of the lines quite easy.
This type of approach is not ideal, the sampling interval for the extracted data is not uniform, and not the same for the two datasets, furthermore the labelling of the x-axis is unclear so it’s difficult to tell exactly which quarter is referred to.
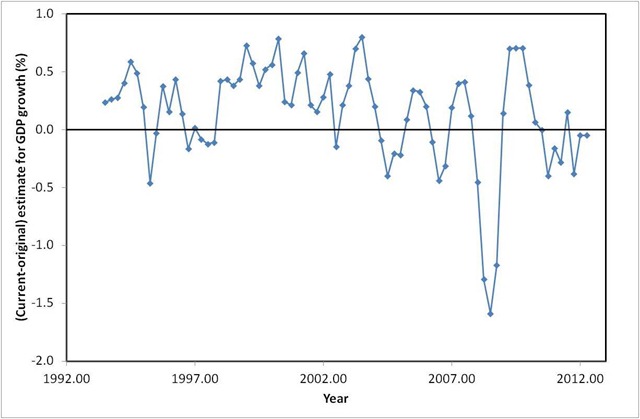
I next loaded up the data into Excel for a bit of quick and easy plotting. To address the sampling problem I used the vlookup function to give me data for each series on a quarterly basis. I can then plot interesting things like the difference between the current and original estimates for each quarter, as shown below:
A few spot checks referring back to the original chart can convince us that we have scraped the original data moderately well. The data also fit with the ONS comment on the article:
…looking back over the last 20 quarters, between the first and most recent estimates, the absolute revision (that is, ignoring the +/- sign) is still only 0.4 percentage points.
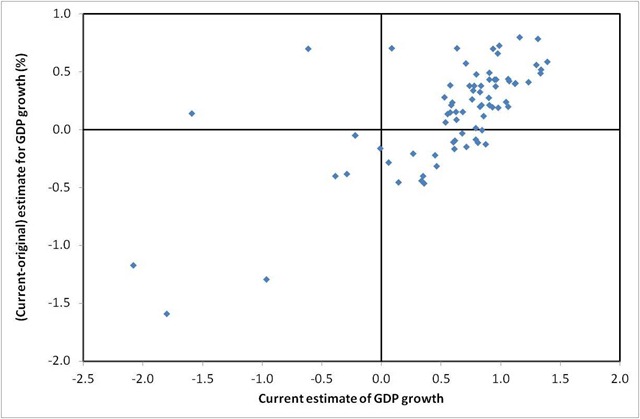
I calculated this revision average and got roughly the same result.We can also plot the size of revisions made as a function of the current estimate of the GDP growth figure:
This suggests that as the current estimate of growth goes up so does the size of the revision: rises are under-estimated, falls in growth are under-estimated in the first instance although this is not a statistically strong relationship. These quarterly figures on GDP growth seem awfully noisy, which perhaps explains some of the wacky explanations for them (snow, weddings, hot weather etc etc) – they’re wild stabs at trying to explain dodgy data which doesn’t actually have an explanation.
The thing is that the “only 0.4 percentage points” that the ONS cites makes all the difference between being in recession and not being in recession!
Footnotes
I uploaded my spreadsheet here, the figures did not import well.


