June 2012 archive

Book Review: Huygens–The Man Behind the Principle by C.D. Andriesse

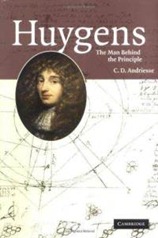
huygens-man-behind-principle-c-d-andriesseThis post is a review of C.D. Andriesse’s biography “Huygens: The Man Behind the Principle”. Huygens Principle concerns the propagation of light but he carried out a wide range of research, including work on clocks, Saturn (discovering its moon “Titan” and hypothesizing the existence of its rings), buoyancy, circular motion, collisions, musical scales and pendulums. Huygens has made passing appearances in my blog posts on the French Académie des Sciences, on telescopes and also on clocks.

On the face of it is surprising that he is not better known, looking around for biographies of him one finds a rather short list. Andriesse puts this down to much of the personal documentation being in Dutch. The scientist in me feels there should be some quantitative way of measuring how “well known” a historical figure is now, and how “important” they were – I suspect this is an impossible programme. On completing the book I suspect a couple of factors play a part here: Huygens represents something of a transitional figure between the work of Galileo/Descartes, and Newton/Leibniz. Similarly his practical work on clocks and telescopes was impressive for its time but superseded not long thereafter. What we do now in physics owes much more to Newton than to Galileo, furthermore Newton although not prolific published more promptly than Huygens and was President of the Royal Society for 20 or so years before his death in post, whilst Huygens left L’Académie des Sciences sometime before his death in not particularly auspicious circumstances. It isn’t entirely clear whilst reading the book, but it becomes obvious that frequently Huygens’ work was done over long periods and only published quite a long time after it was started, often posthumously.

Huygens was born in the Hague in 1629 and died 1695. Christiaan Huygens’ father, Constantijn was a senior Dutch diplomat and a regular correspondent with René Descartes. Constantijn also met Francis Bacon (and was clearly impressed by him), Bacon and Descartes were important in shaping the development of science in the early 17th century. Bacon in particular set the scene for the way of doing science both in the Royal Society and  L’Académie des Sciences. Constantijn set his son off on a regime of study in the classics, with a view to him becoming a lawyer and following in his footsteps as a diplomat. Sometime around 1643, when Christiaan was 14 years old he started to show promise in mathematics.

Huygens senior provided introductions to Marin Mersenne who introduced him to those circles who became the Académie des Sciences in France. Christiaan Huygens was a paid director of science at L’Académie from its foundation in 1666 until he was excluded from it shortly after the death of Jean-Baptiste Colbert, founder of the organisation and his principle patron, in 1683. The exclusion arose from a combination of the loss of this patron, religious differences, absence due to illness, personal vendettas, opposition to membership of any foreigner and his demand for higher remuneration. Aside from this period at L’Académie, Huygens appears to have lived on the wealth and position of his father.

There’s no doubt that he made significant contributions in the area of mechanics, going beyond what Galileo and Descartes had done but his work was superseded almost immediately by that of Newton, and Leibniz, particularly in the methods of calculus which they developed. Calculus is a tool which makes much of the complex geometrical work that Huygens did obsolete. Leibniz was an informal pupil of Huygens, and they kept up a lengthy correspondence. He also had some exposure to Isaac Newton via the Royal Society.

Andriesse claims that Huygens wrote the first physics formula, relating to collisions. I think we should probably take this with a pinch of salt, but looking at the work he did do on circular motion, collisions, buoyancy, the motion of the pendulum and the shape of a catenary as well as his work on optics it is all very familiar to those that studied physics (at least to the age of 18).

Alongside his mathematical and theoretical physics work, Huygens also made contributions to the development of both clocks and telescopes. He introduced the pendulum clock, and a design of his was tested for determining the longitude by the Dutch East India Company. In practical terms this was not successful but it was a valiant first try. He also made lenses and constructed his own telescopes, here he appears to have been a competent technician and an able theoretician but not reaching the level of Newton, who constructed his own reflecting telescope – the first practical example of its type which was not exceeded for some 30 years or so.

This is a detailed biography of Huygens, drawing heavily on his personal correspondence and covering his scientific achievements in some depth, in the manner of Abraham Pais biography of Einstein. Although the book is pretty readable, the style is odd in places – Huygens is referred to frequently as “”Titan” without any real explanation as to why – it may be that in the original Dutch version, entitled “Titan kan niet slapen” (“Titan can not sleep”) this is a bit more obvious. The author also throws in the odd “Iris” when referring obliquely to sex (at least I think that’s what he’s doing!). Occasionally bits of information are scattered through the text, so we learn when Huygens is born and only 10 pages later do we learn where. There is no strong distinction of when Huygens started working on a publication and when it was actually published.

Perhaps more seriously Andriesse makes an attempt at Freudian analysis of some of Huygens illness, I’m no expert in this but I suspect this approach would be considered out-dated these days. It is also here that the translation perhaps wobbles a bit, with Huygens described as having “symptoms of the hypochondriac” which I think may be a mistranslation of melancholia hypochondriaca which I believe refers more generally to mental illness than the specific modern “hypochondria”.

This said, Andriesse’s biography of Huygens is well worth reading. Christiaan Huygens himself is an interesting subject who made important scientific discoveries across a range of areas.

Footnotes

My Evernotes for the book are here.

Beeston Castle

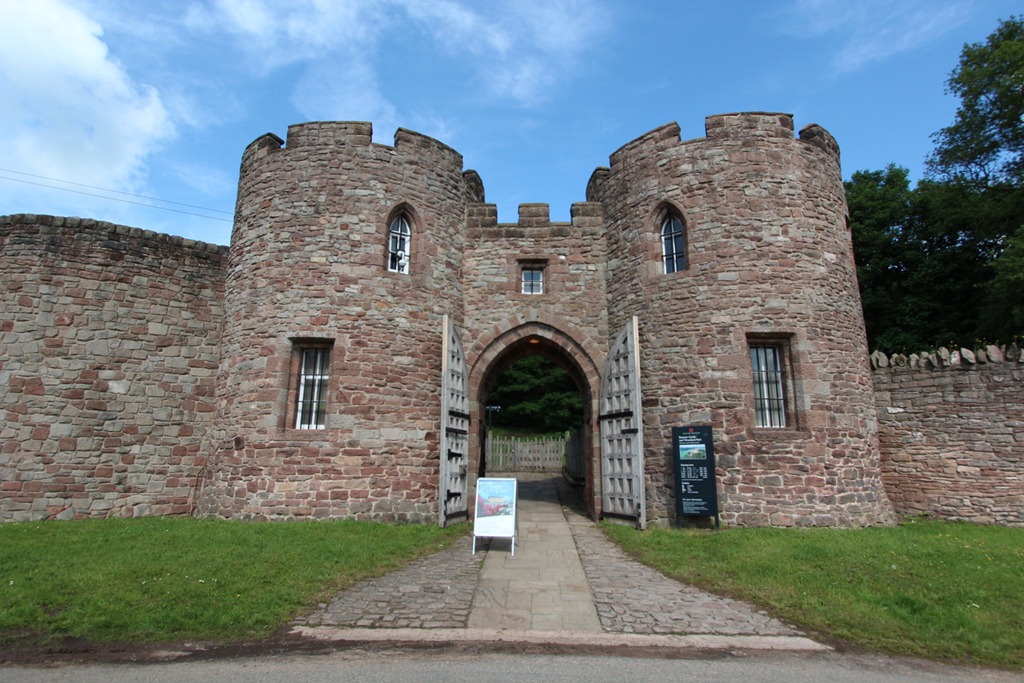
Beeston Castle sits on a promontory on the sandstone ridge which runs down from the Mersey estuary at Frodsham towards Whitchurch. The castle location has been a centre of human activity since the prehistoric age, with significant earthworks put in place during the Bronze Age. The castle is now run by English Heritage, and is entered through a fine Victorian gatehouse. This is the result of a later period in the Castle’s life, during the 19th century when it was owned by Lord Tollemache, and became a tourist attraction. A wall was built at the level of the Cheshire Plain at this time, in part to keep the kangaroos in.

Victorian Ticket office  It felt wrong to remove the notice board which spoils the picture a little.

Heading up the steep hill we come to the outer gatehouse, this was most likely built during the 13th century at the direction of Ranulf III, sixth earl of Chester (1170-1232) in common with the inner ward and other major stone workings. It was built as much of as symbol of his power as for any strictly defensive purposes.

Outer Gatehouse

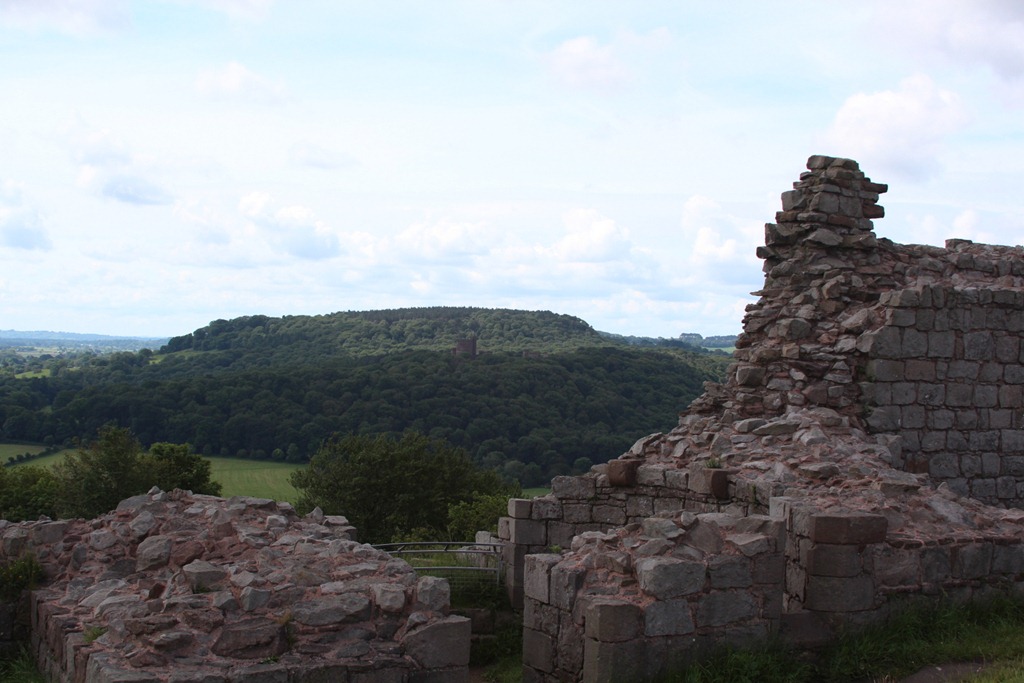
Heading along the outer curtain wall, we get views of Peckforton Castle, which is a Victorian building commissioned by Lord Tollemache which picks up the character of the much older Beeston Castle:

View to Peckforton Castle

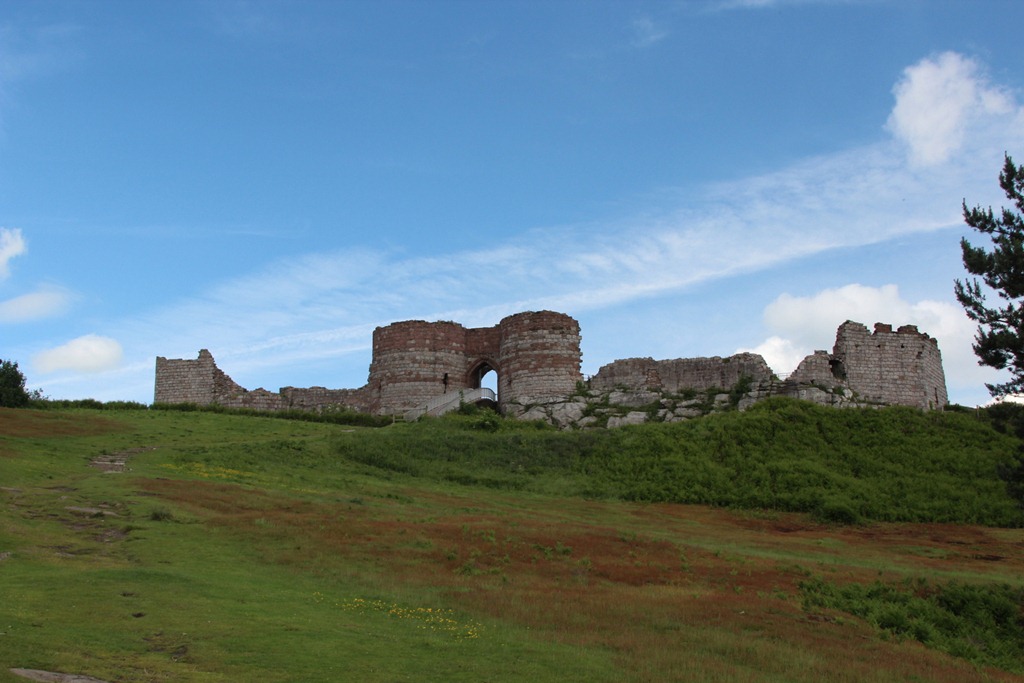
Still further up the hill we see the inner ward of the castle, after the initial work on the castle in the 13th century it was relatively little used although during the English Civil War it was fought over and its decrepit state is as a result of deliberate destruction at the end of the War.

The inner ward

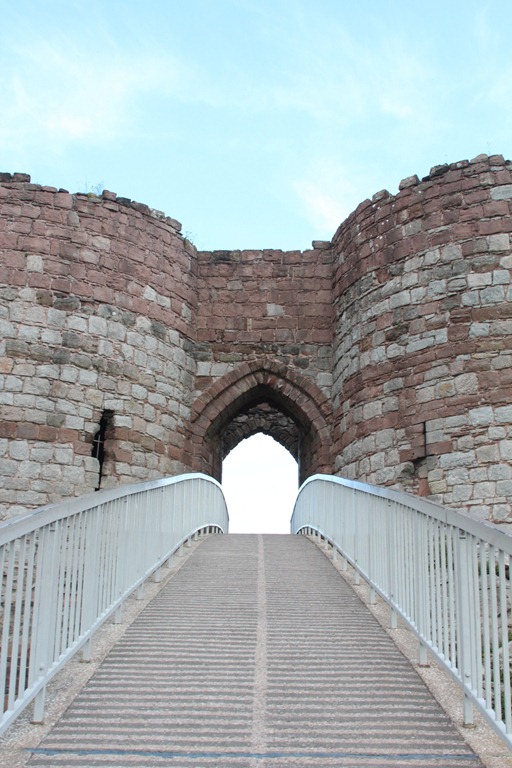
The bridge into the inner ward dates from the 1970s, it’s a very steep climb!

The bridge to the Inner Ward

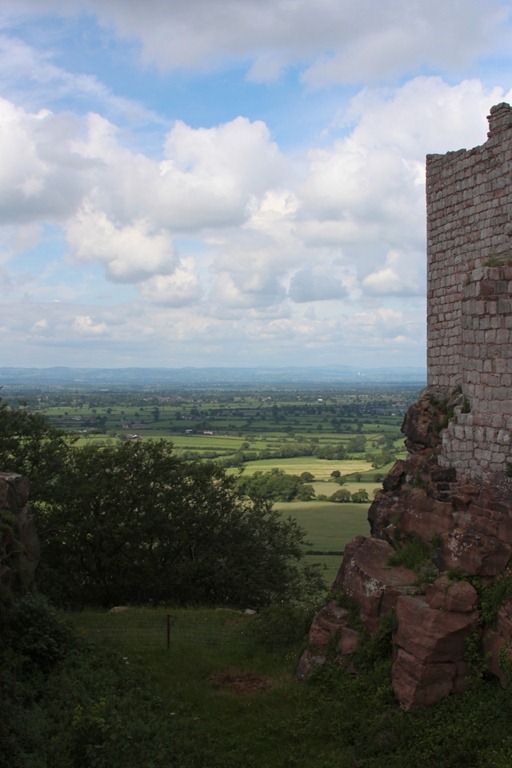
Crossing the bridge over the hand-cut stone channel into the inner ward we can see a fine view towards Chester and North Wales:

View towards Chester from the bridge to the Inner Ward

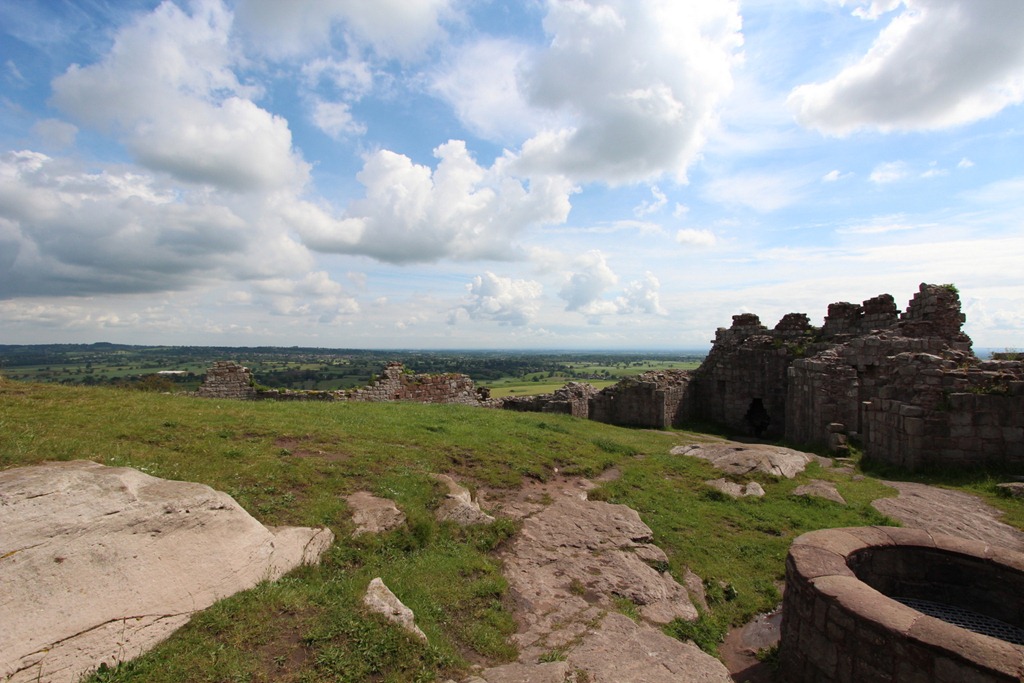
The inner ward is rather rough-hewn, no real attempt to level it has been made:

The inner ward

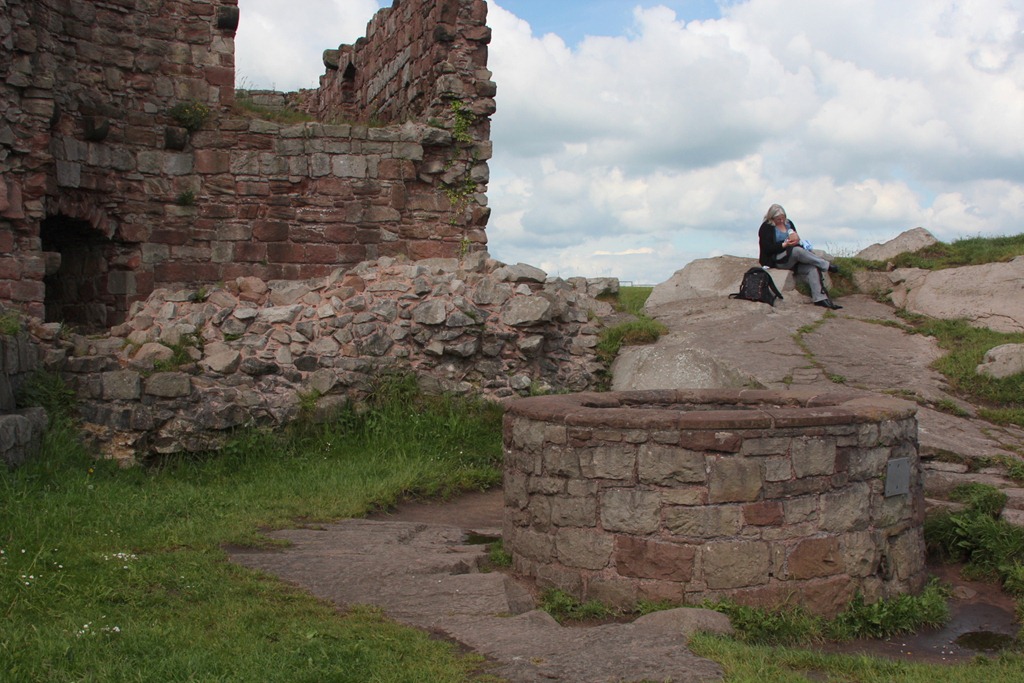
The well seen here in the foreground is very deep, 100m as recorded during investigations in 1935-36 with medieval masonry extending down to 61m.

The inner ward well

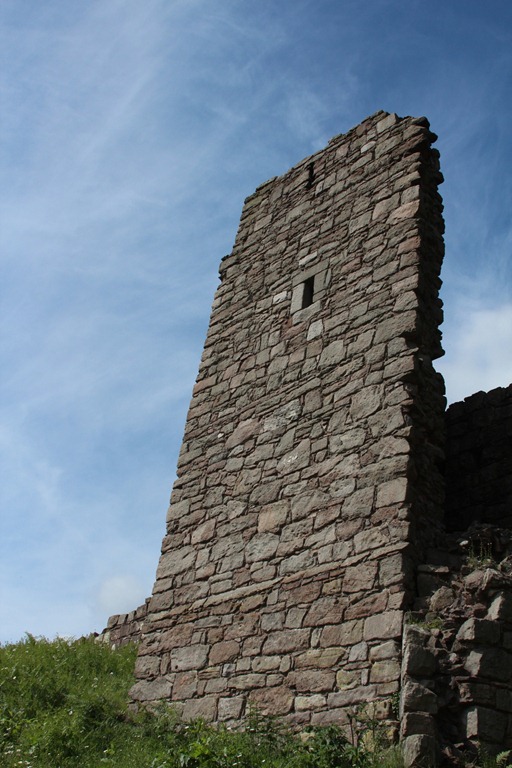
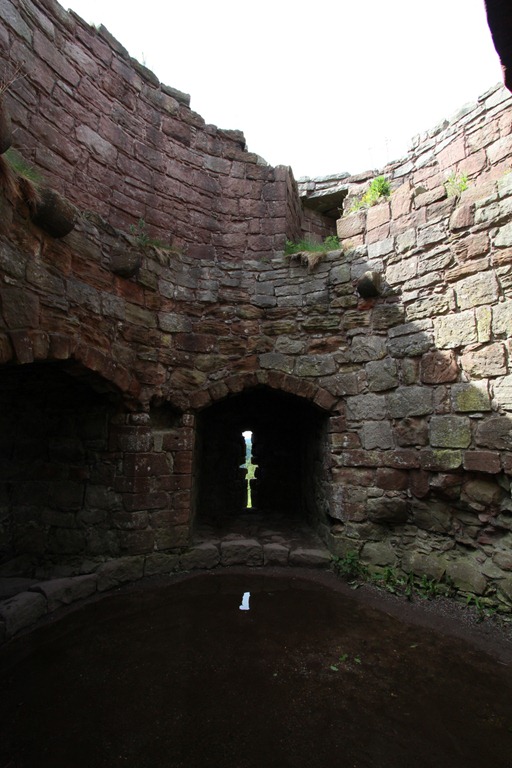
The gatehouse offers some rather sturdy masonry, and following the rain the floor of this guardroom was one big puddle:

Inside the inner ward gatehouse

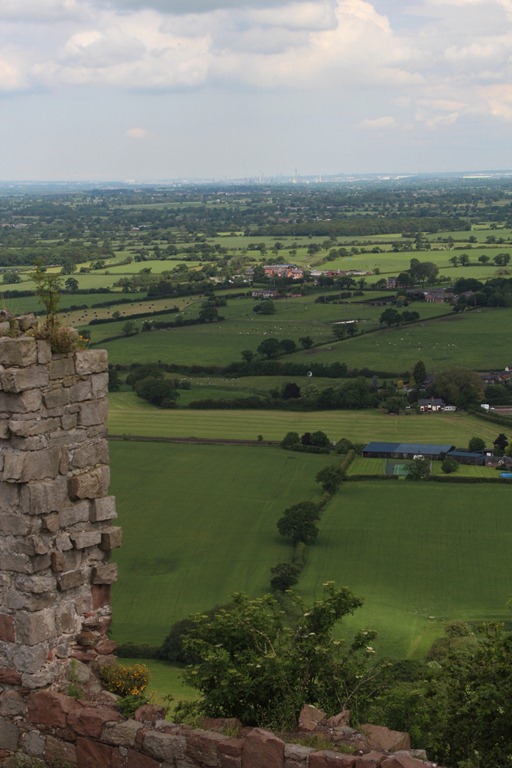
You can some feel of the precipice on which the castle sites from this view looking towards Stanlow:

Looking towards Liverpool

As recently as the 1950s the castle hill was bare of trees but now it is thickly wooded, attracting wildlife such as the great-spotted woodpecker:

Greater-spotted woodpecker

And cute bunny rabbits:

Baby bunny!

The ox-eye daisies are pretty too:

Daisies

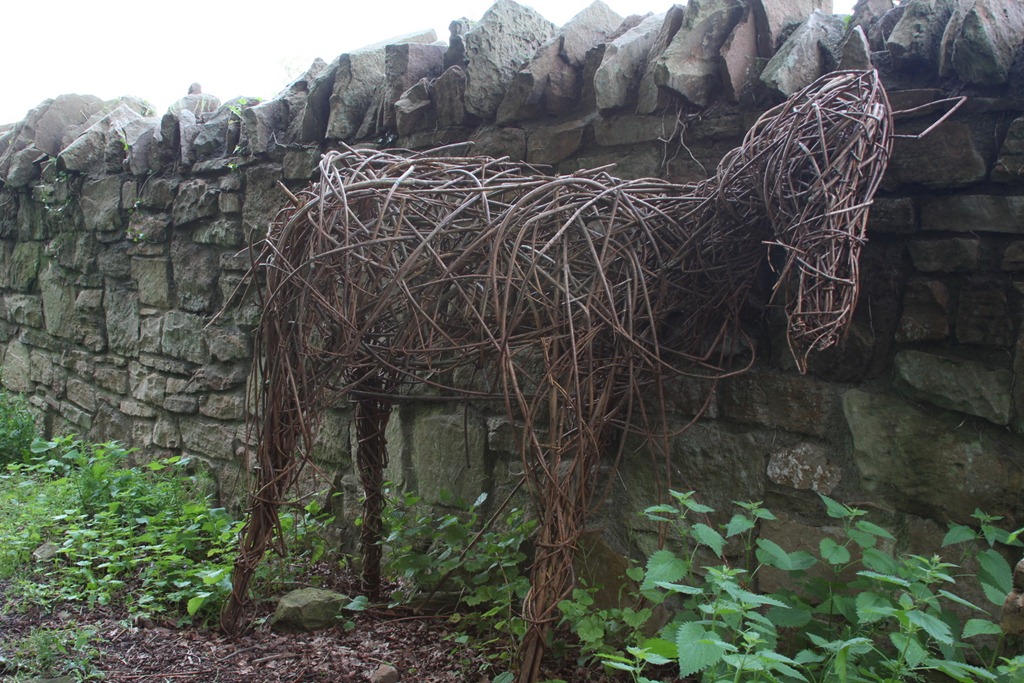
And someone has woven a horse:

Woven horse

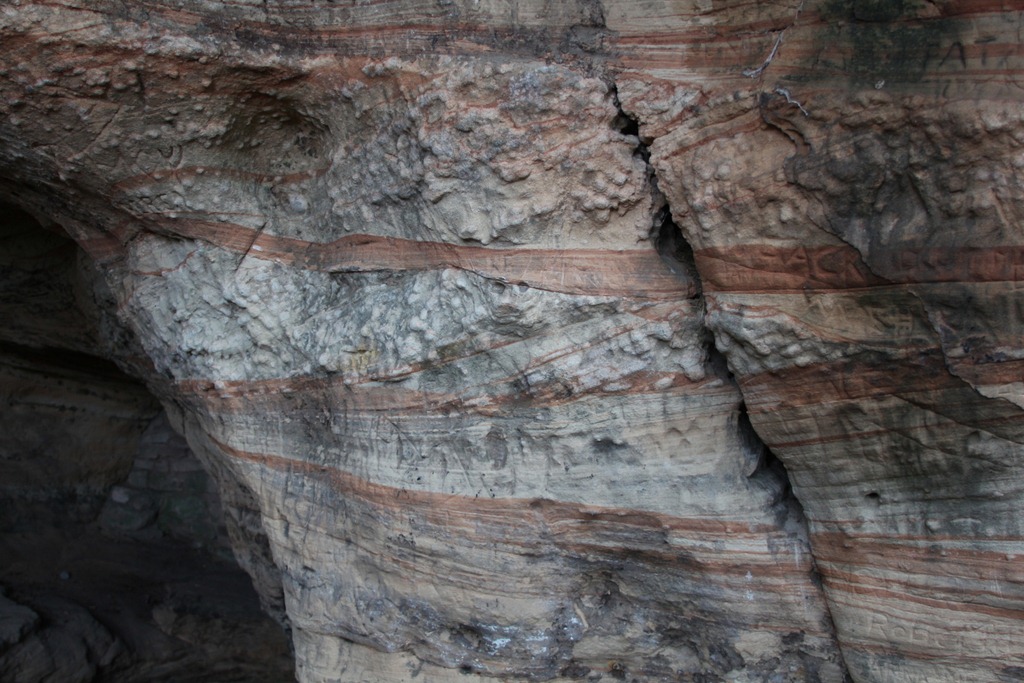
Close to the entrance there are caves, from which sandstone was quarried in the 19th century:

Red sandstone

A rather pleasant morning out with some spectacular views.

References

The wikipedia entry for Beeston Castle is quite brief (here), English Heritage has its own site (here) which has more detail although it is scattered about a bit. The English Heritage Guidebook is a quality production, a little brief but available for a very reasonable sum on Amazon (here)

Book Review: Visualize This by Nathan Yau

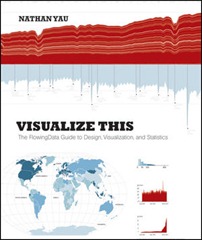
9780470944882 cover.inddThis book review is of Nathan Yau’s “Visualize This: The FlowingData Guide to Design, Visualization and Statistics”. It grows out of Yau’s blog: flowingdata.com, which I recommend, and also his experience in preparing graphics for The New York Times, amongst others.

The book is a run-through of pragmatic methods in visualisation, focusing on practical means of achieving ends rather more abstract design principles for data visualisation; if you want that then I recommend Tufte’s “The Visual Display of Quantitative Information”.

The book covers a bit of data scraping, extracting useful numerical data from disparate sources, as Yau comments this is the thing that takes the time in this type of activity. It also details methods for visualising time series data, proportions, geographic data and so forth.

The key tools involved are the R and Python programming languages; I already have these installed in the form of R Studio and Python(x,y), distributions which provide an environment that looks like the Matlab one with which I have long been familiar with but which sadly is somewhat expensive for a hobby programmer. Alongside this are the freely available Processing language and the Protovis Javascript library which are good for interactive, online visualisations, and the commercial packages Adobe Illustrator, for vector graphic editing, and Adobe Flash Builder for interactive web graphics. Again these are tools I find out of my range financially for my personal use although Inkscape seems to be a good substitute for Illustrator.

With no prior knowledge of Flash and no Flash Builder, I found the sections on Flash a bit bewildering. It also highlights how perhaps this will be a book very distinctively of its time, with Apple no longer supporting Flash on iPhone its quite possible that the language will die out. And I notice on visiting the Protovis website that this is no longer under development: the authors have moved on to D3.js, Openzoom which is also mentioned is no longer supported. Python has been around for sometime now and is the lightweight language of choice for many scientists, similarly R has been around for a while and is increasing in popularity.

You won’t learn to program from this book: if you can already program you’ll see that R is a nice language in which to quickly make a wide range of plots. If you can’t program then you may be surprised how few commands R requires to produce impressive results. As someone who is a beginner in R, the examples are a nice tour of what is possible and some little tricks, such as the fact that plot functions don’t take data frames as arguments: you need to extract arrays.

As well as programming the book also includes references to a range of data sources and online tools, for example colorbrewer2.org – a tool for selecting colour schemes, and links to the various mapping APIs.

Readers of this blog will know that I am an avid data scraper and visualiser myself, and in a sense this book is an overview of that way of working – in fact I see I referenced flowingdata in my attempts to colour in maps (here).

The big thing I learned from the book in terms of workflow is the application of a vector graphics package, such as Adobe Illustrator or, Inkscape, to tidy up basic graphics produced in R. This strikes me as a very good idea, I’ve spent many a frustrating hour trying to get charts looking just right in the programming or plotting language of my choice and now I discover that the professionals use a shortcut! A quick check shows that R exports to PDF, which Inkscape can read.

Stylistically the book is exceedingly chatty, including even the odd um and huh, which helps make it quick and easy read although is a little grating. Many of the examples are also available over on flowingdata.com, although I notice that some are only accessible for paid membership. You might want to see the book as a way of showing your appreciation for the blog in physical and monetary form.

Look out for better looking visualisations from me in the future!