This year there is a fuss because GCSE pass results have not gone up as anticipated. Ultimately this turns out to be an issue with a new English exam which was marked generously in the January sitting when compared to the June sitting, thus relatively disadvantaging the later sitting in this year.
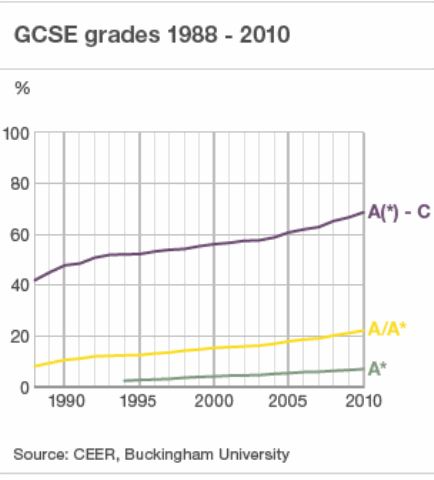
But aside from this, here is an graph showing pass rates for GCSEs since they started in the late eighties:
(source: BBC News)
A steady increase in those achieving grades A-C from 40% when the exam was introduced in 1988 to over 60% now. Never mind the unfairness within this year, what about those disadvantaged by taking the exams a few short years ago?
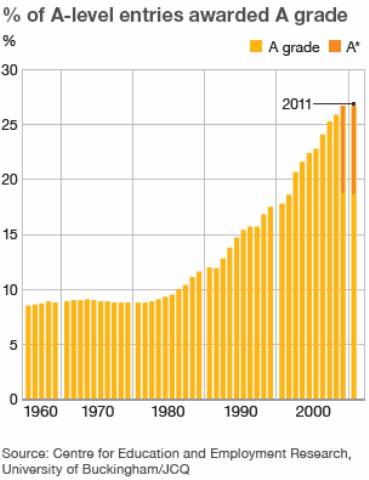
This behaviour is also reflected in A-level results, below is a graph showing the percentage of A grades since the 1970s.
(source: BBC News)
We examine students for several reasons:
1. To provide confirmation that they know certain things in order to be accepted onto further courses or employment;
2. To provide “ranking” information so we might pick the “best” candidates either to accept onto a course, or to employ;
3. To measure the performance of schools, arguably this is a serious misuse of examinations.
It would appear our examination system is focused on 2 rather than 1 but is not sensitive because ever more people are awarded higher grades each year which means distinguishing the best students is ever harder, and the graphs above suggest we cannot make year to year comparisons.
Previously A grades at A-level were awarded as a fixed proportion of the cohort, similarly the other grades. So for example the students with the top 8% marks were awarded an A grade. This scheme has some merit: it assumes that that students have the same performance distribution year on year and uses this property to derive grade boundaries.
My performance at work is graded in a similar way; in my case this is a poor scheme – there are no objective measures of my performance against my colleagues in the form of an exam. Furthermore the distribution is enforced in groups of less than 20 people; there are statistical tests to establish whether a distribution of grades matches a prescribed distribution – these tests come with a caveat that they are invalid for samples smaller than about 50.
However, for a schools examination system these problems are rather less relevant: we have an objective examination system and a cohort of thousands. The current system asks us to believe that every year students are getting better and better: todays A-level students are three times as good as the A-level students of the 1980s, and the GCSE students of today are 50% better than those of the 1980s. Most people outside the education system will find this difficult to believe, and not just because they took their exams in the “olden days”. For the record: I took my A-levels in 1988, and the old fashioned O’ levels in 1986 prior to the introduction of the GCSE.
The current scheme has a strong whiff of political necessity: how can you show your changes to the education system are a success if your marking system is such that grades are awarded in fixed proportion? The current system allows you to show year on year advances, like the production of tractors in the Soviet Union.


6 comments
Skip to comment form
From Buckingham University. No association between inflated A grades, inflated exam results overall and an inflated ‘education’ system elevating anywhere with a book and a Portacabin to the status of a university.
No irony here folks, move along, there’s nothing to see.
It’d surely make sense to cap the grades as it was previously done. That way we can still cover all three of the points that you’ve mentioned. You’re right about it being a bit of a political toy in that higher %5A*-C and so on will show that the government has truly done the best for our students and really transformed the education system to allow more students to pass.
It’s quite interesting to have a look at the grade boundaries in this years Year 10 GCSE Science exams (new syllabus and exam style). In Physics it was 44/60 for an A* or 73%, and a measly17/60 for a C…28%. Chemistry was 38 and 14 (63% for an A* and 23% for a C!) and Biology was 39 and 19. Inflation anyone?
Drew, those boubdaries will be for a higher tier paper where the easiest questions are meant to be grade C standard.
Paul, they are yeah but I’m not convinced that a student should be awarded a C grade for getting 1 in 5 questions right in a Higher Tier paper. In the Foundation Tier you needed 34/60 in the Physics – 56% – and 29/60 in Chemistry, and 33/60 in Biology.
Interestingly, it’s a similar situation to the GCSE English where they grade boundaries went up between Jan and June. This is the first year of these exams, and students and teachers are getting themselves to grips with them. Now that more past papers are available and teachers have more awareness of what is required to achieve the grades next June. This way they can ‘train’ their students to get those grades easier. Those that are better at training their students will ensure their students achieve more highly, despite what will be slightly higher grade boundaries. Another source of grade inflation?
60 marks over 4 grades A* – C. 17 surely neans all grade C qs answered correctly thetefore grade C. Remember the final boundaries ae set after review of borderline papers to maintain standards. I’ve seen the go up and down overvthe years. Says nothing about whether the standards are high enough. Don’t even get me started on teaching to the test. The question “Do we need this for the exam?” is one teason I leapt at the offer of voluntary severance after 26 years’ teaching.
I taught undergraduates for a while, “teaching to the test” is an issue there too – I tended to add asides to my lectures and they’d lose interest if I said they weren’t in the exam, if asked. I’m reading Alan Turing’s biography at the moment – he went off and learned things of his own accord!