Category: Book Reviews

Reviews of books featuring a summary of the book and links to related material

Book review: Cryptocurrency by Paul Vigna and Michael J. Casey


cryptocurrencyThis review was first posted at ScraperWiki.

Amongst hipster start ups in the tech industry Bitcoin has been a thing for a while. As one of the more elderly members of this community I wanted to understand a bit more about it. Cryptocurrency: How Bitcoin and Digital Money are Challenging the Global Economic Order by Paul Vigna and Michael Casey fits this bill.

Bitcoin is a digital currency: the Bitcoin has a value which can be exchanged against other currencies but it has no physical manifestation. The really interesting thing is how Bitcoins move around without any central authority, there is no Bitcoin equivalent of the Visa or BACS payment systems with their attendant organisations or central back as in the case of a normal currency. This division between Bitcoin as currency and Bitcoin as decentralised exchange mechanism is really important.

Conventional payment systems like Visa have a central organisation which charges retailers a percentage on every payment made using their system. This is exceedingly lucrative. Bitcoin replaces this with the blockchain – a distributed ledger in which transactions are encrypted. The validation is carried out by so-called ‘miners’ who are paid in Bitcoin for carrying out a computationally intensive encryption task which ensures the scarcity of Bitcoin and helps maintain its value. In principle anybody can be a Bitcoin miner, all they need is the required free software and the ability to run the software. The generation of new Bitcoin is strictly controlled by the fundamental underpinnings of the blockchain software. Bitcoin miners are engaged in a hardware arms race with each other as they compete to complete units on the blockchain, more processing power equals more chances to complete blocks ahead of the competition and hence win more Bitcoin. In practice mining meaningful quantities these days requires significant, highly specialised hardware.

Vigna and Casey provide a history of Bitcoin starting with a bit of background as to how economists see currency, this amounts to the familiar division between the Austrian school and the Keynesians. The Austrians are interested in currency as gold, whilst the Keynesians are interested in Bitcoin as a medium for exchange. As a currency Bitcoin doesn’t appeal to Keysians since there is no “quantitative easing” in Bitcoin, the government can’t print money.

Bitcoin did not appear from nowhere, during the late 90s and early years of the 20th century there were corporate attempts at building digital currencies. These died away, they had the air of lone wolf operations hidden within corporate structures which met their end perhaps when they filtered up to a certain level and their threat to the current business model was revealed. Or perhaps in the chaos of the financial collapse.

More pertinently there were the cypherpunks, a group interested in cryptography operating on the non-governmental, non-corporate side of the community. This group was also experimenting with ideas around digital currencies. This culminated in 2008 with the launch of Bitcoin, by the elusive Satoshi Nakamoto, to a cryptography mailing list. Nakamoto has since disappeared, no one has ever met him, no one knows whether he is the pseudonym of one of the cypherpunks, and if so, which one.

Following its release Bitcoin experienced a period of organic growth with cryptography enthusiasts and the technically curious. With the Bitcoin currency growing an ecosystem started to grow around it beginning with more user-friendly routes to accessing the blockchain – wallets to hold your Bitcoins, digital currency exchanges and tools to inspect the transactions on the blockchain.

Bitcoin has suffered reverses, most notoriously the collapse of the Mt Gox currency exchange and its use in the Silk Road market, which specialised in illegal merchandise. The Mt Gox collapse demonstrated both flaws in the underlying protocol and its vulnerability to poorly managed components in the ecosystem. Alongside this has been the wildly fluctuating value of the Bitcoin against other conventional currencies.

One of the early case studies in Cryptocurrency is of women in Afghanistan, forbidden by social pressure if not actual law from owning private bank accounts. Bitcoin provides them with a means for gaining independence and control over at least some financial resources. There is the prospect of it becoming the basis of a currency exchange system for the developing world where transferring money within a country or sending money home from the developed world are as yet unsolved problems, beset both with uncertainty and high costs.

To my mind Bitcoin is an interesting idea, as a traditional currency it feels like a non-starter but as a decentralized transaction mechanism it looks very promising. The problem with decentralisation is: who do you hold accountable? In two senses, firstly the technical sense – what if the software is flawed? Secondly, conventional currencies are backed by countries not software, a country has a stake in the success of a currency and the means to execute strategies to protect it. Bitcoin has the original vision of a vanished creator, and a very small team of core developers. As an aside Vigna and Casey point out there is a limit within Bitcoin of 7 transactions per second which compares with 10,000 transactions per second handled by the Visa network.

It’s difficult to see what the future holds for Bitcoin, Vigna and Casey run through some plausible scenarios. Cryptocurrency is well-written, comprehensive and pitched at the right technical level.

Book review: The Information Capital by James Cheshire and Oliver Uberti

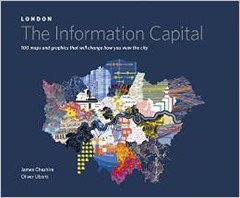
Today I review TheInformationCapitalThe Information Capital by James Cheshire and Oliver Uberti – a birthday present. This is something of a coffee table book containing a range of visualisations pertaining to data about London. The book has a website where you can see what I’m talking about (here) and many of the visualisations can be found on James Cheshire’s mappinglondon.co.uk website.

This type of book is very much after my own heart, see for example my visualisation of the London Underground. The Information Capital isn’t just pretty, the text is sufficient to tell you what’s going on and find out more.

The book is divided into five broad themes “Where We Are”, “Who We Are”, “Where We Go”, “How We’re Doing” and “What We Like”. Inevitably the majority of the visualisations are variants on a coloured map but that’s no issue to my mind (I like maps!).

Aesthetically I liked the pointillist plots of the trees in Southwark, each tree gets a dot, coloured by species and the collection of points marks out the roads and green spaces of the borough. The twitter map of the city with the dots coloured by the country of origin of the tweeter is in similar style with a great horde evident around the heart of London in Soho.

The visualisations of commuting look like thistledown, white on a dark blue background, and as a bonus you can see all of southern England, not just London. You can see it on the website (here). A Voroni tessellation showing the capital divided up by the area of influence (or at least the distance to) different brands of supermarket is very striking. To the non-scientist this visualisation probably has a Cubist feel to it.

Some of the charts are a bit bewildering, for instance a tree diagram linking wards by the prevalent profession is confusing and the colouring doesn’t help. The mood of Londoners is shown using Chernoff faces, this is based on data from the ONS who have been asking questions on life satisfaction, purpose, happiness and anxiety since 2011. On first glance this chart is difficult to read but the legend clarifies for us to discover that people are stressed, anxious and unhappy in Islington but perky in Bromley. You can see this visualisation on the web site of the book (here).

The London Guilds as app icons is rather nice, there’s not a huge amount of data in the chart but I was intrigued to learn that guilds are still being created, the most recent being the Art Scholars created in February 2014. Similarly the protected views of London chart is simply a collection of water-colour vistas.

I have mixed feelings about London, it is packed with interesting things and has a long and rich history. There are even islands of tranquillity, I enjoyed glorious breakfasts on the terrace of Somerset House last summer and lunches in Lincoln’s Inn Fields.  But I’ve no desire to live there. London sucks everything in from the rest of the country, government sits there and siting civic projects outside London seems a great and special effort for them. There is an assumption that you will come to London to serve. The inhabitants seem to live miserable lives with overpriced property and hideous commutes, these things are reflected in some of the visualisations in this book. My second London Underground visualisation measured the walking time between Tube station stops, mainly to help me avoid that hellish place at rush hour. There is a version of such a map in The Information Capital.

For those living outside London, The Information Capital is something we can think about implementing in our own area. For some charts this is quite feasible based, as they are, on government data which covers the nation such as the census or GP prescribing data. Visualisations based on social media are likely also doable although will lack weight of numbers. The visualisations harking back to classics such as John Snow’s cholera map or Charles Booth’s poverty maps of are more difficult since there is no comparison to be made in other parts of the country. And other regions of the UK don’t have Boris Bikes (or Boris, for that matter) or the Millennium Wheel.

It’s completely unsurprising to see Tufte credited in the end papers of The Information Capital. There are also some good references there for the history of London, places to get data and data visualisation.

I loved this book, its full of interesting and creative visualisations, an inspiration!

Book review: How Linux works by Brian Ward


hlw2e_cover-new_webThis review was first published at ScraperWiki.

A break since my last book review since I’ve been coding, rather than reading, on the commute into the ScraperWiki offices in Liverpool. Next up is How Linux Works by Brian Ward. In some senses this book follows on from Data Science at the Command Line by Jeroen Janssens. Data Science was about doing analysis with command line incantations, How Linux Works tells us about the system in which that command line exists and makes the incantations less mysterious.

I’ve had long experience with doing analysis on Windows machines, typically using Matlab, but over many years I have also dabbled with Unix systems including Silicon Graphics workstations, DEC Alphas and, more recently, Linux. These days I use Ubuntu to ensure compatibility with my colleagues and the systems we deploy to the internet. Increasingly I need to know more about the underlying operating system.

I’m looking to monitor system resources, manage devices and configure my environment. I’m not looking for a list of recipes, I’m looking for a mindset. How Linux Works is pretty good in this respect. I had a fair understanding of pipes in *nix operating systems before reading the book, another fundamental I learnt from How Linux Works was understanding that files are used to represent processes and memory. The book is also good on where these files live – although this varies a bit with distribution and time. Files are used liberally to provide configuration.

The book has 17 chapters covering the basics of Linux and the directory hierarchy, devices and disks, booting the kernel and user space, logging and user management, monitoring resource usage, networking and aspects of shell scripting and developing on Linux systems. They vary considerably in length with those on developing relatively short. There is an odd chapter on rsync.

I got a bit bogged down in the chapters on disks, how the kernel boots, how user space boots and networking. These chapters covered their topics in excruciating detail, much more than required for day to day operations. The user startup chapter tells us about systemd, Upstart and System V init – three alternative mechanisms for booting user space. Systemd is the way of the future, in case you were worried. Similarly, the chapters on booting the kernel and managing disks at a very low level provide more detail than you are ever likely to need. The author does suggest the more casual reader skip through the more advanced areas but frankly this is not a directive I can follow. I start at the beginning of a book and read through to the end, none of this “skipping bits” for me!

The user environments chapter has a nice section explaining clearly the sequence of files accessed for profile information when a terminal window is opened, or other login-like activity. Similarly the chapters on monitoring resources seem to be pitched at just the right level.

Ward’s task is made difficult by the complexity of the underlying system. Linux has an air of “If it’s broke, fix it and if ain’t broke, fix it anyway”. Ward mentions at one point that a service in Linux had not changed for a while therefore it was ripe for replacement! Each new distribution appears to have heard about standardisation (i.e. where to put config files) but has chosen to ignore it. And if there is consistency in the options to Linux commands it is purely co-incidental. I think this is my biggest bugbear in Linux, I know which command to use but the right option flags are more just blindly remembered.

The more Linux-oriented faction of ScraperWiki seemed impressed by the coverage of the book. The chapter on shell scripting is enlightening, providing the mindset rather than the detail, so that you can solve your own problems. It’s also pragmatic in highlighting where to to step in shell scripting and move to another language. I was disturbed to discover that the open-square bracket character in shell script is actually a command. This “explain the big picture rather than trying to answer a load of little questions”, is a mark of a good technical book.  The detail you can find on Stackoverflow or other Googling.

How Linux Works has a good bibliography, it could do with a glossary of commands and an appendix of the more in depth material. That said it’s exactly the book I was looking for, and the writing style is just right. For my next task I will be filleting it for useful commands, and if someone could see their way to giving me a Dell XPS Developer Edition for “review”, I’ll be made up.

Book review: Engineering Empires by Ben Marsden and Crosbie Smith

engineering-empiresCommonly I read biographies of dead white men in the field of science and technology. My next book is related but a bit different: Engineering Empires: A Cultural History of Technology in Nineteenth-Century Britain by Ben Marsden and Crosbie Smith. This is a more academic tome but rather than focussing on a particular dead white man they are collected together in a broader story. A large part of the book is about steam engines with chapters on static steam engines, steamships and railways but alongside this are chapters on telegraphy and mapping and measurement.

The book starts with a chapter on mapping and measurement,  there’s a lot of emphasis here on measuring the earth’s magnetic field. In the eighteen and nineteenth centuries there was some hope that maps of magnetic field variation might provide help in determining the longitude. The subject makes a reprise later on in the discussion on steamships. The problem isn’t so much the steam but that steamships were typically iron-hulled which throws compass measurements awry unless careful precautions are taken. This was important as steamships were promoted for their claimed superior safety over sailing vessels, but risked running aground on the reef of dodgy compass behaviour in inshore waters. The social context for this chapter is the rise of learned societies to promote such work, the British Association for the Advancement of Science is central here, and is a theme through the book. In earlier centuries the Royal Society was more important.

The next three chapters cover steam power, first in the factory and the mine then in boats and trains. Although James Watt plays a role in the development of steam power, the discussion here is broader covering Ericsson’s caloric engine amongst many other things. Two themes of steam are the professionalisation of the steam engineer, and efficiency. “Professionalisation” in the sense that when businessmen made investments in these relatively capital intensive devices they needed confidence in what they were buying into. A chap that appeared to have just knocked something up in his shed didn’t cut it. Students of physics will be painfully aware of thermodynamics and the theoretical efficiency of engines. The 19th century was when this field started, and it was of intense economic importance. For a static engine efficiency is important because it reduces running costs. For steamships efficiency is crucial, less coal for the same power means you don’t run out of steam mid-ocean!

Switching the emphasis of the book from people to broader themes casts the “heroes” in a new light. It becomes more obvious that Isambard Kingdom Brunel is a bit of an outlier, pushing technology to the limits and sometimes falling off the edge. The Great Eastern was a commercial disaster only gaining a small redemption when it came to lying transatlantic telegraph cables. Success in this area came with the builders of more modest steamships dedicated to particular tasks such as the transatlantic mail and trips to China.

The book finishes with a chapter on telegraphy, my previous exposure to this was via Lord Kelvin who had been involved in the first transatlantic electric telegraphs. The precursor to electric telegraphy was optical telegraphy which had started to be used in France towards the end of the 18th century. Transmission speeds for optical telegraphy were surprisingly high: Paris to Toulon (on the Mediterranean coast), a distance of more than 800km, in 20 minutes. In Britain the telegraph took off when it was linked with the railways which provided a secure, protected route by which to send the lines. Although the first inklings of electric telegraphy came in in mid-18th century it didn’t get going until 1840 or so but by 1880 it was a globe spanning network crossing the Atlantic and reaching the Far east overland. It’s interesting to see the mention of Julius Reuter and Associated Press back at the beginning of electric telegraphy, they are still important names now.

In both steamships and electric telegraphy Britain led the way because it had an Empire to run, and communication is important when you’re running an empire. Electric telegraphy was picked up quickly on the eastern seaboard of the US as well.

I must admit I was a bit put off by the introductory chapter of Engineering Empires which seemed to be a bit heavy and spoke in historological jargon but once underway I really enjoyed the book. I don’t know whether this was simply because I got used to the style or the style changed. As proper historians Marsden and Smith do not refer to scientists in the earlier years of the 19th century as such, they are “gentlemen of science” and later “men of science”. They sound a bit contemptuous of the “gentlemen of science”. The book is a bit austere and worthy looking. Overall I much prefer this manner of presentation of the wider context rather than a focus on a particular individual.

Book review: Data Science at the Command Line by Jeroen Janssens


datascienceatthecommandlineThis review was first published at ScraperWiki.

In the mixed environment of ScraperWiki we make use of a broad variety of tools for data analysis. Data Science at the Command Line by Jeroen Janssens covers tools available at the Linux command line for doing data analysis tasks. The book is divided thematically into chapters on Obtaining, Scrubbing, Modeling, Interpreting Data with “intermezzo” chapters on parameterising shell scripts, using the Drake workflow tool and parallelisation using GNU Parallel.

The original motivation for the book was a desire to move away from purely GUI based approaches to data analysis (I think he means Excel and the Windows ecosystem). This is a common desire for data analysts, GUIs are very good for a quick look-see but once you start wanting to repeat analysis or even repeat visualisation they become more troublesome. And launching Excel just to remove a column of data seems a bit laborious. Windows does have its own command line, PowerShell, but it’s little used by data scientists. This book is about the Linux command line, examples are all available on a virtual machine populated with all of the tools discussed in the book.

The command line is at its strongest with the early steps of the data analysis process, getting data from places, carrying out relatively minor acts of tidying and answering the question “does my data look remotely how I expect it to look?”. Janssens introduces the battle tested tools sed, awk, and cut which we use around the office at ScraperWiki. He also introduces jq (the JSON parser), this is a more recent introduction but it’s great for poking around in JSON files as commonly delivered by web APIs. An addition I hadn’t seem before was csvkit which provides a suite of tools for processing CSV at the command line, I particularly like the look of csvstat. csvkit is a Python tool and I can imagine using it directly in Python as a library.

The style of the book is to provide a stream of practical examples for different command line tools, and illustrate their application when strung together. I must admit to finding shell commands deeply cryptic in their presentation with chunks of options effectively looking like someone typing a strong password. Data Science is not an attempt to clear the mystery of these options more an indication that you can work great wonders on finding the right incantation.

Next up is the Rio tool for using R at the command line, principally to generate plots. I suspect this is about where I part company with Janssens on his quest to use the command line for all the things. Systems like R, ipython and the ipython notebook all offer a decent REPL (read-evaluation-print-loop) which will convert seamlessly into an actual program. I find I use these REPLs for experimentation whilst I build a library of analysis functions for the job at hand. You can write an entire analysis program using the shell but it doesn’t mean you should!

Weka provides a nice example of smoothing the command line interface to an established package. Weka is a machine learning library written in Java, it is the code behind Data Mining: Practical Machine Learning Tools and techniques. The edges to be smoothed are that the bare command line for Weka is somewhat involved since it requires a whole pile of boilerplate. Janssens demonstrates nicely how to do this by developing automatically autocompletion hints for the parts of Weka which are accessible from the command line.

The book starts by pitching the command line as a substitute for GUI driven applications which is something I can agree with to at least some degree. It finishes by proposing the command line as a replacement for a conventional programming language with which I can’t agree. My tendency would be to move from the command line to Python fairly rapidly perhaps using ipython or ipython notebook as a stepping stone.

Data Science at the Command Line is definitely worth reading if not following religiously. It’s a showcase for what is possible rather than a reference book as to how exactly to do it.