Category: Book Reviews

Reviews of books featuring a summary of the book and links to related material

Book review: The Mythical Man-month by Frederick Brooks Jr.

mythical-man-monthNext up The Mythical Man-Month: Essays on Software Engineering by Frederick Brooks Jr.

This is a classic in software engineering which I’ve not previously read, I guess because it is more about software project management rather than programming itself. That said it contains the best description I have seen as to why we love to program, it is a page long so I won’t quote it in full but essentially it divides into 5 parts.

  1. the joy of making things;
  2. the joy of making things which other people find useful;
  3. the joy of solving puzzles;
  4. the joy of learning;
  5. the joy of working in such a malleable medium;

The majority of the book was written in the mid-seventies, following the author’s experiences in the previous decade, delivering the IBM OS/360 system. This means it reads like Asimov’s Foundation in places, dated technology, dated prose, but at the same time insightful. This is the 20th anniversary edition, published in 1995 which includes 4 new chapters tacked on the end of the original book. Two of these – No Silver Bullet and No silver Bullet – refired are a couple of essays from the eighties around the idea that there are no silver bullets to making software production greatly more efficient – this is in the context of hardware improvements which were progressing at unimaginable speed – Brooks was looking for routes to similar evolution in software development.

The other two new chapters are a bullet point summary of the original book and a retrospective on the first publication. The bullet point summary chapter removes the need for my usual style of review!

The core of the book is the observation that large software projects frequently fail to be delivered as scheduled. There then follow some chapters on addressing this issue. The Mythical Man-Month chapter is the most famous of these, it essentially says the enticing idea of throwing more people at a problem will speed up delivery is wrong. In some cases this is trivially true – you may have seen the example from the book that two women do not produce a baby in 4.5 months rather than 9 months for a single woman. The reason increasing team numbers for software development similarly fails is the cost in time of effective communication between more people, and the cost in time of onboarding new people. Despite our knowledge we still routinely under-estimate programming tasks, largely through mis-placed optimism.

As mentioned above, The Mythical Man-Month is quite dated. The anachronisms come in several forms, there is the excitement over computer text-editing systems – a revelation at the time of OS/360 was being developed. There is a whole chapter devoted to memory/storage usage which I am pretty sure is no longer a concern except in a few niche cases. There is quite a lot of discussion of batch versus time share systems, from a time when there were one or maybe two computers in a building rather than one on every desk, even one in every pocket. There are role anachronisms, where a team has two secretaries and a "Program Clerk" whose role it is to type stuff into the computer!

There are some places where Brooks describes practices which sound quite modern but differ slightly differently to the current sense. So "architecture" in his parlance is more about interface design than "architecture" as we would describe it now. There is some pair-like programming but it has a leader and a follower rather than equals. Agile is mentioned but not in the modern sense.

I was interested to read Brooks disdain of flowcharts. I remember learning about these – including proper stencils from my father – a programmer trained in the early sixties. Brooks argument is that the flowchart is useful for programming in low-level languages like assembler but not useful for high level languages – particularly those using the "structured programming" approach which was new at the time. Structured programming replaces the GOTO statements found in earlier languages with blocks of code executed on if – then – else conditions and similar.

In a chapter entitled Plan to throw one away Brooks talks about the inevitability of the first iteration of a product being thrown away to be replaced by a better thought out version although he caveats this a little by allowing for progressive replacement. He notes that maintenance costs can be 40% of original cost and each new version fixing bugs has a 20% chance of introducing new bugs. This means the progressive replacement approach is a losing game.

In some ways this book is depressing, nearly 50 years after it was written software projects are still being delivered late with great regularity. On a more positive note I believe that the widespread availability of web APIs and online module libraries (such as PyPI for Python) can produce the sort of large uptick in programmer productivity that Brooks’ felt was out of reach. Perhaps this will not be seen as a productivity boost since it simply means the systems we aim to build are more complex and the number of lines of code measure of code does not capture the complexity of external libraries. The consistent user interfaces provided by Mac OS and Windows are also something Brooks was looking for in his original publication.

Is The Mythical-Man Month still worth reading? I’d say a qualified "yes", the issues it describes are still pertinent and it draws on quantitative research about teams of software developers which I believe will still be broadly relevant. It is a relatively short, easy to read, book. It gives a glimpse into the history of computing. On the downside, much of the incidental detail is so far out of date to be distracting.

Book review: The Earth Transformed by Peter Frankopan

frankopanIt is rare that I am menaced by the sheer size of a book but The Earth Transformed by Peter Frankopan has done this to a degree. The Silk Roads, by the same author is similarly massive. So in a break from my usual habit I am going to review as I read.

The book is about the interplay of climate and humanity, and how humanity impacts the environment with an attempt to cover history across the world rather than focussing on Western Europe.

The extensive footnotes for this book are found in a separate downloadable pdf.

0 – Introduction – Frankopan is a year younger than me – born in 1971, and his early memories were shaped by news reports of acid rain, the fear of nuclear winter and Chernobyl – all stark demonstrations of man’s potential impact on the environment.

1 – The World from the Dawn of Time(4.5bn-7m BC) – The earth’s environment has always been changing, in deep time there was a much lower concentration of oxygen in the atmosphere. Those animals we see around us are the result of evolution through multiple cataclysmic environmental events.

2 – On the origins of our species (7m BC-12,000BC) – Climate change in central Africa and growing social groups led to speciation of the hominid group. We started large scale manipulation of the environment – managing forests with fire – 65,000 years ago.

3 – Human interactions with Ecologies (c.12000-c.3500BC) – End of the Younger Dryas and the start of the Holocene is a key point for civilisations, the climate becomes more benign and stable and larger settlements start to grow.

4 – The first cities and trade networks (c3500-c2500 BC) – the first cities are founded, and arguably the first anthropogenic climate change takes place. With cities came hierarchies, ownership and vulnerability to shocks and disease.

5 – On the risks of living beyond one’s means (2500BC-c.2200BC) – One such shock is the great drought of 2200BC, often seen as a global phenomena but actually rather complicated with different regional effects and an impact which was perhaps most obvious on the ruling class.

6 – The first age of connectivity (c.2200-c.800BC) – the environment provides resources unevenly, and so trade is necessary as societies become more sophisticated, these trade networks lead to interdependence so when one society falls others are impacted. The trade is not just in goods but also in ideas.

7 – Regarding Nature and the Divine (c1700-c.300BC) – Religions which we still see today arose several hundred years BC, and many of them made references to the environment. The ruler was often an intermediary to the gods/control of the weather – rain being particularly important. Even in this time there were exhortations to preserve the environment.

8 – The Steppe Frontier and Formation of Empires (c.1700-c.300BC) – the Eurasian steppes provided a catalyst for the growth of empires in the neighbouring region, alongside the domestication of the horse in about 3000BC. This combination provided rapid transport, and the flatness of the terrain made expansion easy. There is also an interplay between nomadic and pastoral peoples.

9 – The Roman Warm Period (c.300BC-AD c.500) – the Roman Empire grew at a time of benign and stable climatic conditions – and fell when those climatic conditions changed. Contemporary writers noted the pollution in Rome and other big cities. We can see the lead of the Roman Empire in Greenland ice cores.

10 – The Crisis of Late Antiquity (AD c.500-c.600) – the decades from 530AD saw multiple volcanic eruptions leading to global cooling, food shortages, and the rise of disease (the Justinian plague) and the fall of empires.

11 – The Golden Age of Empire (c.600-c.900) – the Prophet Mohammad’s agreement with the ruling elite in Mecca in 628AD provided an Arab identity that grew to an Empire stretching across North Africa and into Spain. Trade grows with sub-Saharan Africa. These patterns are replicated in the Americas and the Far East. Literacy grew in the eighth century with the introduction of paper from China. Empires started to decline in the 9th century as another warmer drier period started.

12 – The Medieval Warm Period (c.900-c.1250) – the Medieval Warm Period was both warm, and stable with unusually low levels of volcanic activity. During this time there was a large growth in global population, and Northern Europe saw significant growth. This growth was a result of improvements in crops and technology, as well as the benign climate.

13 – Disease and the formation of a New World (c.1250-c.1450) – the 13th century saw the rise of the Mongol empire, under Genghis Khan, stimulated by wetting weather in the steppe leading to more productive pasture when other areas were suffering drought. But the wet weather and the extensive trade networks of the Empire led to the rise of Black Death. Interesting parallels between post-Plague and post-1918 influenza Europe – the roaring twenties.

14 – On the expansion of Ecological Horizons (c.1400-c.1500) – the 14th and 15th century saw the fall of some of those empires that rose during the earlier more benign and stable weather, more driven by the instability of large empires than by climate change. It also saw the European "exploration" of the world and the large scale transport of plant and animal species across the world.

15 – The Fusion of the Old and the New Worlds (c.1500-c.1700) – the European "discovery" of the New World introduced a massive migration of flora and fauna around the world, potatoes, tomatoes,chillies from the New World to the Old. Pigs, sheep, goats and cattle from the Old to the New.

16 – On the exploitation of Nature and People (c.1650-c.1750) – the new sugar, tobacco and cotton industries required a large workforce, resistant to malaria, and Africans fitted the bill – this chapter to about slavery.

17 – The Little Ice Age (c.1550-c.1800) – the Little Ice Age has long been known but its magnitude was quite variable around the world, many things have been ascribed to the Little Ice Age but connections and causality are tenuous. The 17th century saw significant developments in military technology and spending on professional armies in Europe. There was also a large rise in urbanisation. Variable weather, uncertain crops hit some countries hard.

18 – Concerning Great and Little Divergences (c.1600-c.1800) – 1600-1800 was the period in which the economies of Europe diverged from those of Asia and Africa, and in Europe the North pulled away from the South. The introduction of the potato to Europe was important, as was maize and manioc (cassava) to Africa.

19 – Industry, extraction and the Natural World (c.1800-c.1870) – markets became truly global with wheat from North America cheaper to ship from Canada to Liverpool than from Dublin to Liverpool. Colonialism was at its height with Britain leading the world and the Americans expelling indigenous people from their own lands.

20 – The Age of Turbulence (c.1870-c.1920) – new resources became ripe for exploitation like rubber, guano and tin. Industrialisation proceeded apace. Concerns about climate began, and the Carrington Event and the Krakatoa eruption started scientists thinking about global impacts. Global pandemics made an appearance for both people and animals.

21 – Fashioning New Utopias (c.1920-c.1950) – the middle years of the 20th century saw a new wave of exploitation with oil, copper, uranium and more recently lithium becoming important resources. Colonialism receded but was replaced by corporate and government interference in states. In the Soviet Union ecological damage, and great human upheaval was driven by the dash to modernise but in a communist rather than capitalist framework.

22 – Reshaping the Global Environment (the mid-Twentieth Century) – the USSR and the USA started large scale environmental modification projects, see Teller’s proposals to use nuclear explosions to change just about anything.

23 – The Sharpening of Anxieties (c.1960-c.1990) – in the sixties the USA and USSR got heavily into weather modification, and the Americans into Agent Orange in Vietnam. The USA programme was conducted in deep secrecy, and when it was revealed there was an outcry which lead to a treaty banning such environmental modification. This led to a wider thaw of Cold War interactions.

24 – On the edge of Ecological Limits (c.1990-today) – the 1990s saw the fall of the Soviet Union and the rise of Industrial China. It also saw the discussions over climate change heating up.

25 – Conclusions – Frankopan’s conclusion is rather gloomy, he highlights how we are failing to act on climate change but then points we may suffer worse consequences from volcanic activity, or an asteroid strike!

There are themes across the whole book, in the environment we see periods of stable climate interspersed by periods of change – particularly driven by volcanic eruptions. From the human side we see the growing scale of civilisations, larger civilisations with more connections are more vulnerable to instability and the fall of other civilisations. We see ever increasing urbanisation and exploitation of the environment at ever greater scale.

Although initially intimidating, I found The Earth Transformed rather readable – perhaps because I saw each chapter as a separate essay.

Book review: Masterminds of Programming by Federico Biancuzzi and Shane Warden

mastermindsThe next review in my work related books thread is of Masterminds of Programming by Federico Biancuzzi and Shane Warden. The subtitle, Conversations with the creators of major programming languages, is a good summary of the contents. The book is an edited transcript of interviews with the creators of major programming languages.

Frequently the conversation is with a single person but in a couple of cases two or even three people are interviewed. This is one small failing of the book because particularly where they interview three people the resulting chapter is very long and a bit repetitive.

There is a valid question to ask as to whether languages can be so closely tied to single individuals, and in the afterword the authors touch on this saying that one of the recurring themes was that the people they interviewed succeeded because they surrounded themselves with brilliant people. Some of these languages started off as one-man exercises but most grow from collective academic or corporate efforts, and even the one-man band languages developed a fairly formal community.

The languages covered are object-oriented languages (C++, Objective-C, Java, C# and Eiffel), functional languages (ML, Haskell, APL), glue languages originally designed to occupy the space between Unix and C (Awk, Lua, Python, Perl), languages designed for embedding (Forth and PostScript). Dartmouth Basic, SQL and UML are basically their own things. To be honest UML does not really fit into the book in my view since it is a formal design description language rather than an executable programming language. The languages were created between 1964 (Dartmouth BASIC) or maybe 1957 (for APL) and 2000 (C#).

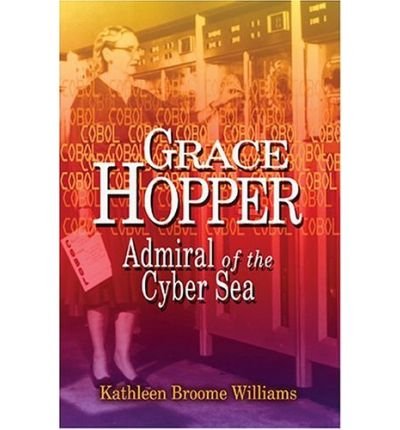
I was sad to note the absence of a chapter on FORTRAN but John Backus, the inventor of FORTRAN died in 2007 – a couple of years before the book was written. Also there are no women interviewed in this book, a quick search reveals there are a number of programming languages invented or co-invented by women. COBOL, invented by Grace Hopper would be a prime candidate here but she died in 1992. Small Talk which inspired a lot of object-oriented languages was co-invented by Adele Goldberg and LOGO co-invented by Cynthia Solomon would fit rather well into the book.

The interviewers clearly had a set of questions which they asked each interviewee and the varying results indicate which questions chimed with the interests of the interviewee. The topics included concurrency, how to manage feature requests for languages, working in teams, debugging, software engineering and teaching.

The authors of the object-oriented languages (C++, Objective-C, Java, C# and Eiffel) are somewhat at each others throats. However, they are all pretty clear that object-orientation is the way forward for large software projects although they see encapsulation rather than inheritance or reuse as the key benefits it brings. There is a degree of condescension towards those languages that they perceived to have been successful as a result of marketing.

The authors of the functional programming languages are more interested in formal specification, I feel I should learn more about type theory. I have looked at Haskell in the past, and found it a bit challenging, however ideas from Haskell and other functional programming languages have made it into Python, my preferred language. The chapter on APL was entertaining, it was conceived and developed as a coherent formalised system for describing algebra the authors did not touch a computer for a number of years after “development” started in the mid-fifties. It is written as symbols which are challenging to enter on a conventional keyboard, you can see it in action here.

Tedd Codd’s relational database design was core to the success of SQL, and is largely why it has not been replaced. SQL was designed alongside IBM’s System R but Oracle produced the first commercial SQL engine.

I learnt a few random facts from the book which I can’t write as a coherent story:

  • Charles H. Moore – author of Forth: “Legacy code may be the downfall of our civilisation”;
  • Awk is an acronym of its authors names, Alfred Aho, Peter Weinberger and Brian Kernighan;
  • Tom Love – co-author of Objective-C – “100,000 lines of code fills a box of paper and requires 2 people to maintain it. Test cases should be another two or three boxes.”!

The book would have really benefited from some sample code in each language, perhaps in the manner of Exercises in Programming Style which implements the same algorithm in different programming styles. I picked up Beautiful Code by Andy Oram and Greg Wilson, interviews with programmers, for my reading list. As well as The Mythical Man-month by Frederick P. Brooks, Jr which I probably should have read years ago.

I found this book really interesting, in part as a way of understanding how the programming languages I use every day of my working life came into being but also to understand the mindset of highly skilled programmers.

Book review: Resonate by Nancy Duarte

resonateI picked up Resonate: Present Visual Stories That Transform Audiences by Nancy Duarte following a couple of recommendations in Storytelling with Data by Cole Nussbaumer Knaflic. You can see how Resonate  influenced the storytelling elements of Knaflic’s book.

Resonate  is about the importance of storytelling in making presentations, and a model to construct compelling presentations which will leave your audience primed to go off and take the action you want.

The book is beautifully produced, as you might expect from an author from a company which provides consulting on making presentations. In the front material Duarte mentions VisualStory(tm) and Presentation Form(tm) which are products from her company but through the rest of the book Duarte Design is scarcely mentioned.

The nine chapter titles make a pretty good summary of the book, I have added my own comments to clarify a bit:

  1. Why resonate? – audiences change when you make a personal connection with them, a presentation is not just about facts.
  2. Lessons from myths and movies – adding elements of storytelling makes a presentation much more impactful – people have been writing about the mechanics of storytelling for a couple of thousand years!
  3. Get to know the hero – the hero is the audience. In scriptwriting terms the hero goes on a well-defined journey and we are going to take the audience on a similarly structured journey. We tend to write presentation centred on ourselves, our companies and our products – they should be centred on the audience.
  4. Define the journey – you need to be clear about the intended outcome of your presentation, and make everything in your presentation about reaching that outcome.
  5. Create meaningful content – this is about compiling the content for your presentation, it includes a call to include personal stories and also to research your audience.
  6. Structure reveals insights – this is about structuring the content you’ve compiled. A lot of the structure of a presentation is about alternating between “what is” and “what could be”.
  7. Deliver something they’ll always remember – providing contrasts in presentational style and content to maintain interest.
  8. There is always room to improve – this chapter emphasises how much work successful presenters put into their presentation, both in initial preparation but also reflecting on performances.
  9. Change your world – this is largely a call to action for us to go out and do it!

There’s a final chapter called Inspiration is everywhere which has case studies on Mozart – how the sonata structure reflects a presentation structure, Alfred Hitchcock – how a presentation (or a film) is a well-planned collaborative endeavour and e.e. cummings – breaking the rules to get impact. There are a plenty of case studies spread through the book demonstrating how speakers structure compelling presentations, analysing them in terms of the model Duarte proposes. I liked the fact that the case studies included “people like me”, Richard Feynman – a physicist, and Marcus Covert – a biologist.

We’ve all heard of “this meeting could have been an email”, Duarte mentions at one point “this presentation could have been a report”. She sees a presentation as a platform to provoke action, produce change and a raw presentation of facts does not fit this definition – this could be a written report. I find a lot of the presentations I give fall into this category.

Resonate talks mainly in terms of high importance presentations: end of year reports to investors, presentations to win multi-million dollar research grants, Steve Jobs iphone presentation – big productions involving significant work, and a team of collaborators. It is up to the reader to determine how to make these ideas work for their own more modest circumstances.

I was also pleased that some elements that I include instinctively such as personal stories, and passion, and doing some research on my potential audience are recommended and effective. I think my change on reading Resonate will be more focus on The Big Idea and what I want the audience to do when they leave the presentation. There is also a strong indication that my slides should contain less text then I add – Duarte says that a single slide filled with text would take an audience 30 seconds to read, and they will either be reading your slide or listening to you, not both. She also says as a rule of thumb a slide should not be on screen for more than 2 minutes.

Overall, I’m glad I read this book – at times I found the style a bit grating but the content is thought-provoking. As a physical scientist I’m used to the idea that physical models are correct and can be proved. Duarte’s model of how to build and deliver a successful presentation is not a physical model – it is a framework for discussion and a source for new ideas.

Book review: Data Points by Nathan Yau

data_pointsI picked up Data Points by Nathan Yau as a recommended book on exploratory data analysis in Storytelling with data. I have previously read Nathan Yau’s book Visualize This.

Visualise This  was very focussed on the technical side of producing data visualisations, with code samples and so forth. This is a “bigger picture” book divided into three sections: context, exploration and presentation.

Context can be summarised as: who, how, what, when, where, why. Context is covered explicitly in the first chapter using the medium of Yau’s wedding photos as an example. Spinning off from here is a mention of the Quantified Self movement, there was a time a few years ago when this was popular – people would record aspects of their life in great detail and build visualisations from them. This was enabled by the growth of the first generations of smartphone which made this sort of data collection easy. Yau points out – and I think all data scientists can agree with this – that most of the job is actually collecting together the data required for a project and getting it into a shape to visualise.

The “Exploration” chapters start with an overview of what a data visualisation is, one of the strengths of this book is the many examples of visualisations, in this case going as far back as William Playfair in 1786 with the invention of the bar chart. This chapter also highlights that a data visualisation can be a flow chart, or it can be an abstract piece of art which is based on data. Yau cites John Tukey’s Exploratory Data Analysis a number of times which was published in the 1970s at a time when the author felt the need to explain that a “bold” effect can be achieved using a pen rather than a pencil. The point being that we now have immense power in readily available software to produce visualisations at the click of a button which would have taken an expert many hours of manual labour in the relatively recent past.

The next chapters provide a summary of how we build a data visualisation starting with the fundamental building blocks: title, visual cues (the data), coordinate system, scale and context elements. The visual cues are further broken down into attributes like position, length, angle, direction, shapes and so forth.

Once this groundwork has been done, there is an extensive taxonomy of chart types including more esoteric plots such as the cartogram (where geographic areas are distorted to show the relative sizes of variables), and radar or polar plots which, along with calendar heatmaps are useful for showing periodic timeseries data.
The “Visualising with clarity” chapter starts to talk about presentation, and how the purpose of visualisations is to allow comparisons. I think the useful takeaway from this chapter for me was that distribution plots are rather more difficult for the lay viewer to interpret than practitioners realise.
I found the penultimate chapter on “Designing for an audience” a little brief. A handy hint here was to design presentations for the audience at the back of the room – nobody likes to hear “this is probably too small for you to see” from a speaker. Another useful tip for making interactive presentations is that people like to find out about themselves, so if you have data on people then make it easy for viewers to “look themselves up” because that’s the first thing they are going to do.

The book finishes with a chapter on technologies, some of them such as R, Adobe Illustrator, Microsoft Excel, Google Sheets, Tableau are still around and remain good choices. Yau’s favoured combination is R with Adobe Illustrator used to polish the results. The Javascript library Data Driven Documents (d3) and Processing are still active. Other systems like IBM’s Many Eyes project, MapBox’s TileMill have disappeared. Javascript Libraries Raphael and the Javascript Infovis Toolkit appear dormant, in the sense that the activity on their GitHub repositories is minimal. Nobody talks about Flash and ActionScript anymore.

Data Points is much more a book about exploratory data visualisation then Storytelling with data, I think Yau believes that exploratory data analysis is an exercise in storytelling. The strength of this book is the wide range of examples used to illustrate the points being made through the book. The style is chatty, it is not a difficult read. It is less focussed on delivering specific lessons in making data visualisations than Storytelling with data.