Tag: javascript

Book review: JavaScript Patterns by Stoyan Stefanov

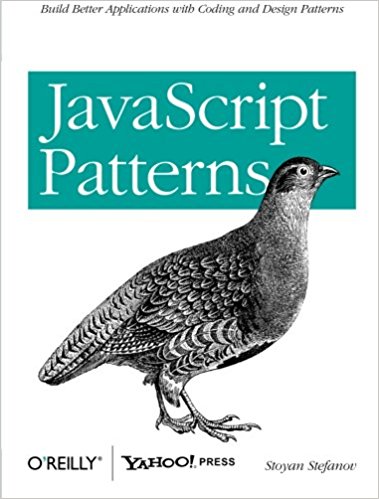
More technology related reviewing next, JavaScript Patterns by Stoyan Stefanov. This is part of my continuing effort to learn JavaScript.

For me this isn’t a question of learning the nuts and bolts of a language but rather one of learning to use it fluently and idiomatically.

I thought this book might be in the spirit of the original “Gang of four” design patterns, but although it mentions these design patterns it is more generally about good style in JavaScript. The book is divided into eight chapters including an introduction.

The first substantive chapter on “essentials” talks mainly about variable declarations and some odds and ends. The most interesting one of these was the behaviour of parseInt which converts a string into an integer. Except if the string starts with a zero, as ISO8601 days and months would, then parseInt assumes it is a number in base 8 (octal)!! I can foresee many long hours trying to debug this problem without this forewarning. This chapter also discusses the importance of coding style conventions.

The second chapter talks about literals and constructors. It strikes me that much of this is about unwinding the behaviour of developers more used to statically-typed languages. The JavaScript way is to create objects by example, rather than take a class definition and derive from that. Although in the permissive manner of many languages it will let you do it either way. Since this book was written JavaScript has gained a “class” keyword which allows you to construct classes as you might in Java or C#.

Next up are functions, JavaScript shares Python’s view of functions as objects, allowing them to be passed as arguments. This is particularly important in JavaScript to provide “callback” functionality which is very useful when doing asynchronous programming. I learn here that the “currying” of function is named after Haskell Curry, who also has a whole language named for him. I always feel when passing functions as arguments that I am fiddling with the underpinnings of reality – it can make debugger difficult too.

I found the idea of functions that redefine themselves on first run interesting, it sounds useful and dangerous at the same time.

The chapter on object creation patterns is all about introducing module like behaviour and namespacing to JavaScript which at the time the book was written were not part of the language. Also covered are making private properties by hiding them in function closures.

The code reuse chapter is largely about patterns for achieving inheritance-like behaviour. This introduces a range of patterns which build up to almost exactly replicate class-based inheritance.

Finally we meet some of the classic Gang of Four design patterns. Some of these patterns, such as the iterator pattern, have been absorbed entirely into the core of languages like Python and more recently, JavaScript. The Observer patterns is implemented in web browsers as events, which are ubiquitous. Perhaps the lesson of this chapter is that some of the Gang of Four patterns have been absorbed into the core of languages, we use them almost without thinking. The Strategy Pattern, which determines algorithms at runtime, fits well with the chapter on functions and JavaScript’s view of functions as objects.

The book finishes with a chapter on patterns for the Document Object Model, or rather JavaScript in the browser. It includes well-known advice such as not testing for browser type but rather testing for functionality. It also has advice on optimising JavaScript for deployment.

There is minimal mention of specific tools or libraries in this regard, although Yahoo’s YUI library is mentioned a few times – Stefanov has worked on this library so this is unsurprising, and not unreasonable.

This book had more of the air of Douglas Crockfords’ JavaScript: The Good Parts than a book on patterns which was what I was expecting. Alternatively perhaps “JavaScript for users of statically-typed languages”, as such it probably works pretty well for Python programmers too although modules have always been built-in to Python and there is a “class” keyword for specifying classes.

JavaScript Patterns is readable though, I’m glad I picked it up.

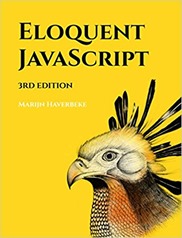
Book review: Eloquent Javascript by Marijn Haverbeke

eloquent_javascriptThis is a review of a more technical book, Eloquent JavaScript by Marijn Haverbeke. The book has the appearance of being about learning programming from scratch but I suspect anyone using it as such would struggle. However, if you have some background in programming it is something of a delight.

The book is divided into three parts, on JavaScript itself, the web browser, and node.js – where JavaScript can run without a browser. Along with a description of the core features of the language there are some significant examples, elaborated over full chapters.

These are quite engaging although a bit off the wall. One concerns were-squirrels, another crows, making a pixel art editor and a platform game seem rather tame in comparison. These examples show you how you should use language features, rather than just giving you a pile of bricks from which to construct your building.

JavaScript has evolved since it was first introduced in 1995 with a major update in 2015 including modules, promises, and generators amongst other things – Haverbeke covers these (highlighting what is new). This is useful to know since I started programming in JavaScript a while back where I observed, for example, that arrays were looped over by index, but now I find I no longer need to do this.

Coming to JavaScript from another language I find the event driven, asynchronous features of the language most difficult to understand, and the older JavaScript way of using callbacks to handle these features produces code which is difficult to read – certainly to my eyes. Promises offer a clearer way of implementing asynchronous code. 

Importing modules still feels like an area undergoing much needed development. Originally JavaScript had no built-in functionality to handle modules, but this gap was filled with third party libraries. Now module management has been built into the language but a lot of legacy code uses incompatible third party libraries, and node.js doesn’t fully support the new module features (as far as I can tell).  Haverbeke mentions how some of these difficulties are handled with the toolchain associated with JavaScript.

JavaScript seems to have some pretty wacky features: month numbers start at zero, exactly like absolutely no system of date description I have ever seen. The case-switch syntax seems really odd, although I understand it is inherited from C/Java like languages. JavaScript’s try/catch functionality is indiscriminate by default which is considered bad style in Python although there are workarounds for this. 

Although I’ve been working with browsers and JavaScript for the last 6 years or so, I still learnt new things about how browsers work. Such as the different applications of the onclick attribute and addEventListener, the former only allows for one listener per element.

One of the examples uses “long polling” to demonstrate how to update a web page at regular intervals, or when the content changes due to actions elsewhere.

The material on node.js was new to me. I’m aware I should probably be writing tests for my JavaScript code, and node.js is the easier way of doing this. node.js is based on the Chrome V8 JavaScript engine with extensions for handling Input/Output amongst other things, features which belong on the server side rather than the browser, client side.

I quite like that, in common with Python, JavaScript uses convention to make class methods private. Basically programmers agree not to use a method if it’s name starts with an underscore! 

Python (my favoured language) and JavaScript both have the air of being little things designed to smooth your path rather than serious languages for serious projects like C, C++, Java, Fortran, and C#. However, Python is arguably the most important language in data science applications and many of the big internet companies have significant investment in Python code. Whilst JavaScript is arguably the most important language in the world at the moment, almost everything that happens in a web browser has JavaScript behind it.

The book finishes with a chapter on performance, I found this really interesting. JavaScript engines have a multi-stage approach to compiling JavaScript into executable code. It starts with a quick and dirty compile, but then returns to do optimisations if code is run frequently. Somewhat disconcertingly different JavaScript engines handle the programmers attempts at optimisation differently i.e. you can optimise your code for Google Chrome only to discover it runs more slowly in Microsoft Edge.

There’s no description of the JavaScript dev environment or tool chain in Eloquent JavaScript. Although I missed this it is probably best not to include in a book such as this – tools change rapidly and what works for one developer doesn’t work for another both in aesthetic and practical terms.

I think this is one of the most enjoyable programming books I’ve read. It covers the core features of the language concisely but then goes on to illustrate how to use those features. It also discusses the key environments in which JavaScript runs.


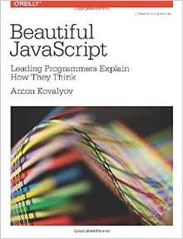
Book review: Beautiful JavaScript edited by Anton Kovalyov

beautiful_javascriptI have approached JavaScript in a crabwise fashion. A few years ago I managed to put together some visualisations by striking randomly at the keyboard. I then read Douglas Crockford’s JavaScript: The Good Parts, and bought JavaScript Bible by Danny Goodman, Michael Morrison, Paul Novitski, Tia Gustaff Rayl which I used as a monitor stand for a couple of years.

Working at ScraperWiki (now The Sensible Code Company), I wrote some more rational code whilst pair-programming with a colleague. More recently I have been building demonstration and analytical web applications using JavaScript which access databases and display layered maps, some of the effects I achieve are even intentional! The importance of JavaScript for me is that nowadays when I come to make a GUI for my analysis (usually in Python) then the natural thing to do is build a web interface using JavaScript/CSS/HTML because the “native” GUI toolkits for Python are looking dated and unloved. As my colleague pointed out, nowadays every decent web browser comes with a pretty complete IDE for JavaScript which allows you to run and inspect your code, profile network activity, add breakpoints and emulate a range of devices both in display and network bandwidth capabilities. Furthermore there are a large number of libraries to help with almost any task. I’ve used d3 for visualisations, jQuery for just about everything, OpenLayers for maps, and three.js for high performance 3D rendering.

This brings me to Beautiful JavaScript: Leading Programmers Explain How They Think edited by Anton Kovalyov. The book is an edited volume featuring chapters from 15 experienced JavaScript programmers. The style varies dramatically, as you might expect, but chapters are well-edited and readable. Overall the book is only 150 pages. My experience is that learning a programming language is much more than the brute detail of the language syntax, reading this book is my way of finding out what I should do, rather than what it is possible to do.

It’s striking that several of the authors write about introducing class inheritance into JavaScript. To me this highlights the flexibility of programming languages, and possibly the inflexibility of programmers. Despite many years of abstract learning about object-oriented programming I persistently fail to do it, even if the features are available in the language I am using. I blame some of this on a long association with FORTRAN and then Matlab which only introduced object-oriented features later in their lives. “Proper” developers, it seems, are taught to use class inheritance and when the language they select does not offer it natively they improvise to re-introduce it. Since Beautiful JavaScript was published JavaScript now has a class keyword but this simply provides a prettier way of accessing the prototype inheritance mechanism of JavaScript.

Other chapters in Beautiful JavaScript are about coding style. For teams, consistent and unflashy style are more important than using a language to its limits. Some chapters demonstrate just what those limits can be, for example, Graeme Roberts chapter “JavaScript is Cutieful” introduces us to some very obscure code. Other chapters offer practical implementations of a maths parser, a domain specific language parser and some notes on proper error handling.

JavaScript is an odd sort of a language, at first it seemed almost like a toy language designed to do minor tasks on web pages. Twenty years after its birth it is everywhere and multiple billion dollar businesses are built on top of it. If you like you can now code in JavaScript on your server, as well as in the client web browser using node.js. You can write in CoffeeScript which compiles to JavaScript (I’ve never seen the point of this). Chapters by Jonathan Barronville on node.js and Rebecca Murphey on Backbone highlight this growing maturity.

Anton Kovalyov writes on how JavaScript can be used as a functional language. Its illuminating to see this discussion alongside those looking at class inheritance-like behaviour. It highlights the risks of treating JavaScript as a language with class inheritance or being a “true” functional language. The risk being that although JavaScript might look like these things ultimately it isn’t and this may cause problems. For example, functional languages rely on data structures being immutable, they aren’t in JavaScript so although you might decide in your functional programming mode that you will not modify the input arguments to a function JavaScript will not stop from you from doing so.

The authors are listed with brief biographies in the dead zone beyond the index which is a pity because the biographies could very usefully been presented at the beginning of each chapter. They are: Anton Kovalyov , Jonathan Barronville, Sara Chipps, Angus Croll, Marijn Haverbeke, Ariya Hidayat, Daryl Koopersmith, Rebecca Murphey, Danial Pupius, Graeme Roberts, Jenn Schiffer, Jacob Thorton, Ben Vinegar, Rick Waldron, Nicholas Zakas. They have backgrounds with Twitter, Medium, Yahoo and diverse other places.

Beautiful JavaScript is a short, readable book which gives the relatively new JavaScript programmer something to think about.

Analysing LIDAR data for the UK

I’m currently between jobs for a couple of weeks, so I have time to play with data.

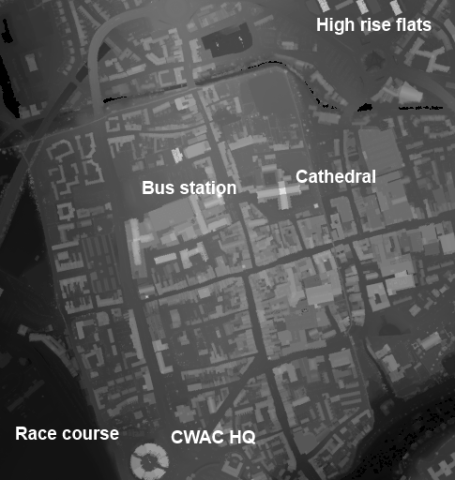
The Environment Agency (EA) has recently released it’s LIDAR data for England amounting to several terabytes of the stuff. LIDAR is a laser ranging technology which gives you the height profile of the surface under inspection. You can get a feel for the data from this excerpt of central Chester:

SJ46-Chester-512x512

The brightness of a pixel shows the height of a feature, so the race course (lower left) appears dark since it is a low flat region close to the River Dee. The CWAC HQ building is tall and appears bright. To the north of the city are a set of three high rise flats, which appear bright. The distinctive cross-shape of the cathedral, with it’s high, bright central tower is also visible. It’s immediately obvious that LIDAR is an excellent tool for picking out the footprint of buildings.

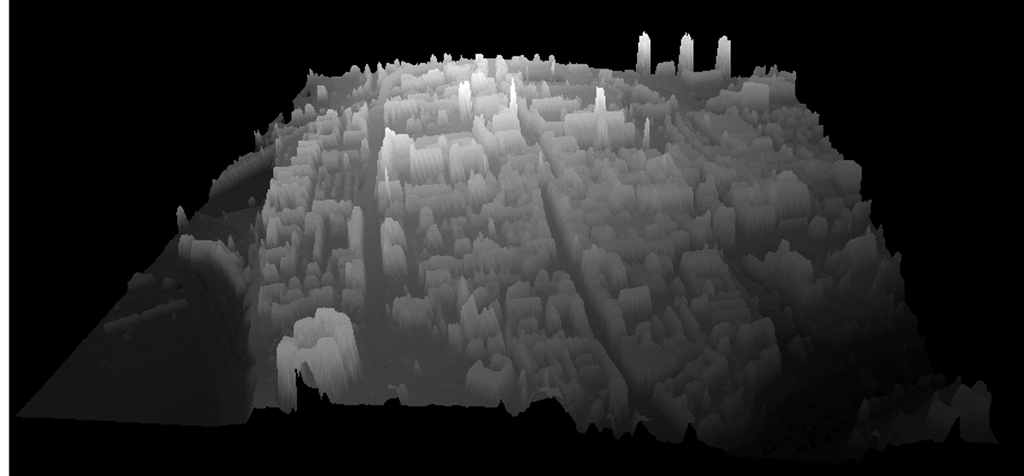
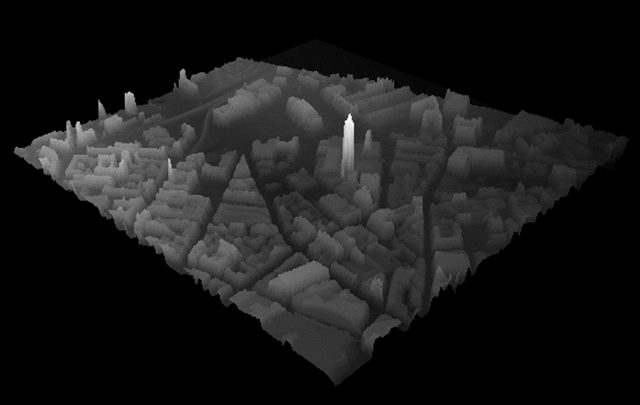
We can use the image above to make a 3D projection view where the brightness of a pixel is mapped to height:

Chester-3D

The orientation for this image is the same as that in the first image, the three tower blocks are visible top right, and the CWAC HQ visible lower left.

The images above used the lowest spatial resolution data, each pixel is 2mx2m. The data have released have spatial resolutions 2m down to 25cm for selected areas. Looking at the areas with the high resolution data available it becomes very obvious what the primary uses of the data are: flood and coastal defences.

You can find the LIDAR data here. It’s divided up into several datasets. Surface data gives height information including all objects on the land such as buildings, trees, vehicles and so forth whilst Terrain data is processed to remove these artefacts and show the pristine land surface.

Composite data are data compiled to give maximum coverage by combining data from surveys conducted in different years and at different resolutions whilst Tile data are the underlying raw data collected in different years and different resolutions. The coverage sliders show the coverage of each dataset. The data are for England only.

The images of Chester shown above are an excerpt from a 10kmx10km tile, shown below:

SJ46

Chester is on the left of this image, above the dark bend of River Dee flood plain. To the right hand side we can see the valley of the River Gowy, and its tributaries – features which are not obvious on the ground or in Google Maps. The large black area is where there is no data, smaller irregular black seem to correlate with water, you might just be able to pick out the line of the Shropshire Union canal cutting through the middle of the image.

I used Chester as an illustration because that’s where I live. I started looking at this data because I was curious, and I’ve spent a happy few days downloading data for lots of different places and playing with it.

It’s great to see data like this being released under permissive conditions. The Environment Agency has been collecting this data for its own purposes, and it’s been available from them commercially for a while – no doubt as a result of a central government edict to maximise revenue from it.

Opening the data like this means the curious can have a rummage, and perhaps others will find a commercial value in it.

I’ve included a few more images below. After them you can see the technical details of how to process these data and make the visualisations for yourself, the code is all in this GitHub repository:

https://github.com/IanHopkinson/defra-lidar-viewer

It is shared under the MIT license.

Liverpool in 3D with the Radio City tower

Liverpool-3D

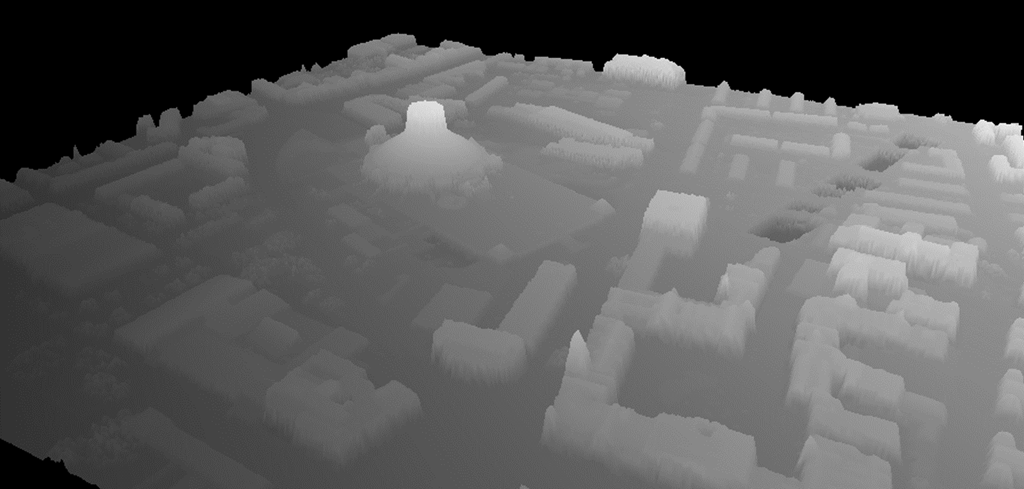
Liverpool Metropolitan Cathedral at 1m resolution

Liverpool-Metropolitan-cathedral-3D

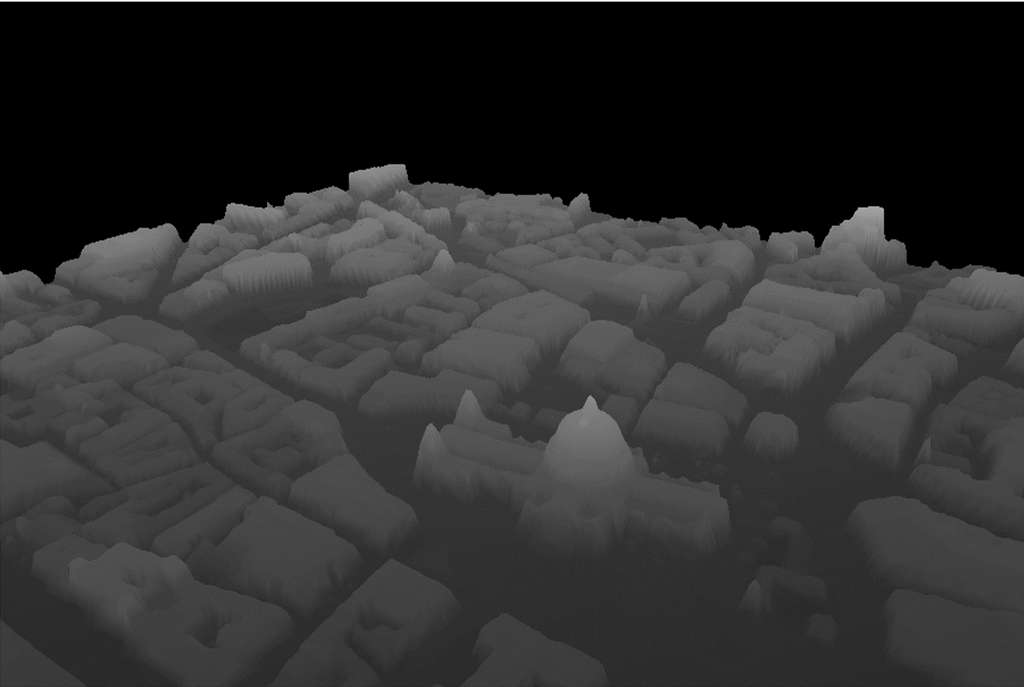
St Paul’s Cathedral

StPauls-3D

Technical Details

The code used to make the figures in this blog post can be found here:

https://github.com/IanHopkinson/defra-lidar-viewer

The GitHub repository contains a readme file which describes the code, and provides links to the original data, other useful commentary and the numerous bits of code I borrowed from the internet.

The data start as sets of zipped text file archives, each archive contains the data for a 10kmx10km OS National Grid square – Chester is in the SJ46 cell. An archive contains a maximum of 100 text files, each one containing data for a single 1kmx1km square, the size of this file depends on the resolution of the data. I wrote a Python program to read the data for a 10kmx10km cell and convert it into a PNG format image. This program also calculates the bounding box in latitude and longitude for the cell. The processing program works fine for 2m and 1m resolution data. It works just about for 50cm data but is slow and throws memory errors. For 25cm resolution data it doesn’t yet work.

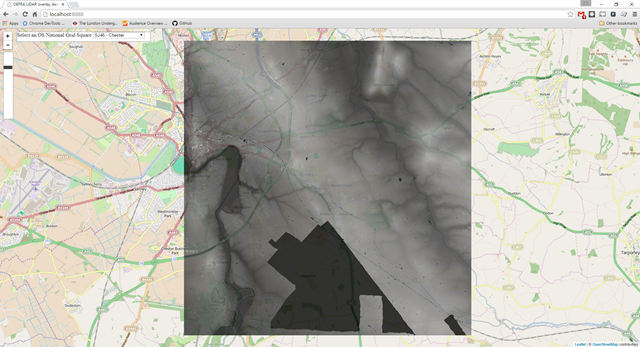
I made a visualisation using the leaflet.js library which allows you to overlay the PNG images generated above onto OpenStreetMap maps. The opacity of the image can be varied with a slider so that you can match LIDAR features to map features. The registration between the two data sources is pretty good but there are systematic problems which I believe might be due to different mapping projections being used by the Ordnance Survey and OpenStreetMap.

map-overlay

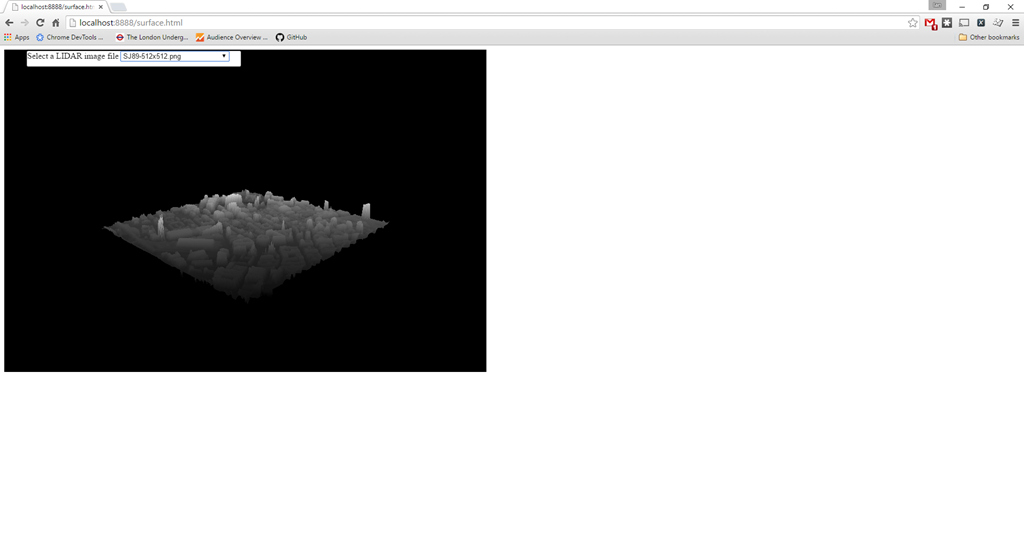
A second visualisation tool uses the three.js library to make an interactive 3D view. The input data are manual crops of approximately 512×512 from the raw PNGs, I did this using Paint .NET but other image editors would work fine. Larger images work but they are smoothed to 512×512 in the rendering. A gotcha here is that the revision number of the three.js library is important – the code for this visualisation leant heavily on previous work by others, and whilst integrating new functionality it was important to use three.js source files from the same revision. This visualisation allows you to manipulate the view with the mouse, it takes while to load up but once loaded it is pretty fast. Trying to upload a subsequent image doesn’t work.

3D-view

I’m still working on the code, I’d like to be able to process the 25cm data and it would be good to select an area from the map and convert it to 3D view automatically.

The London Underground – Can I walk it?

caniwalkitThere are tube strikes planned for 25th August 2015 and 28th August 2015 with disruption through the week. The nature of the London Underground means that it is not all obvious that walks between stations can be quite short. This blog post introduces a handy tool to help you work out “Can I walk it?

You can find the tool here:

http://www.caniwalkit.co.uk/

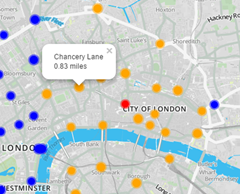
To use it start by selecting the station you want to walk from, either by using the “Where am I?” dropdown or by clicking one of the coloured station symbols (or close to it). The map will then refresh, the station you selected is marked by a red disk, the stations within 1.5 miles of the starting station are marked by an orange disk and those more than 1.5 miles away are marked by a blue disk. 1.5 miles is my “walkable” threshold, it takes me about 25 minutes to walk that far. You can enter your own “walkable” threshold in the “I will walk” box and press refresh or select a new starting station to refresh the map.

The station markers will show the station names on mouseover, and the distances to the starting station once it has been selected.

This tool comes with no guarantees, the walking distances are estimated and these estimates may be faulty, particularly for river crossings. Weather conditions may make walking an unpleasant or unwise decision. The tool relies on the user to supply their own reasonable walking threshold. Your mileage may vary.

To give a little background to this project: I originally made this tool using Tableau. It was OK but tied to the Tableau Public platform. I felt it was a little slow and unresponsive. It followed some work I’d done visualising data relating to the London Underground which you can read about here.

As an exercise I thought I’d try to make a “Can I walk it?” web application, re-writing the original visualisation in JavaScript and Python. I’ve been involved with projects like this at ScraperWiki but never done the whole thing for myself. I used the leaflet.js library to provide the mapping, the Flask library in Python to serve the data, Boostrap to make it look okay and Docker containers on Digital Ocean to deploy the application.

The underlying data for this tool comes from Open Street Map, where the locations of all the London Underground stations are encoded as latitude and longitude. With this information in hand it is possible to calculate the distances between stations. Really I want the “walking distance” between stations rather than the crow flies distance which is what this data gives me. Ideally to get the walking distance I’d use Google Directions API but unfortunately this has a rate limit of 2500 calls per day and I need to make about 36000 calls to get all the data I need!

The code is open source and available in this BitBucket repository:

https://bitbucket.org/ian_hopkinson/london-underground-app

Comments and feedback are welcome!