J.B.S. Haldane, when asked “What has the study of biology taught you about the Creator, Dr. Haldane?”, he replied:
“I’m not sure, but He seems to be inordinately fond of beetles.”
The National Museum of Science & Industry (NMSI) has recently released a catalogue of its collection in easily readable form, you can get it here. The data includes descriptions, types of object, date made, materials, sizes, and place made – although not all objects have data for all these items. Their intention was to give people an opportunity to use the data, now who would do such a thing?
The data comes in four 16mb CSV files plus a couple of other smaller ones covering the media library (pictures) and a small “events” library. I’ve focussed on the main catalogue. You can load these files individually into Microsoft Excel, each one has about 65536 rows so they’re a bit of a pain to use, alternatively you can upload them to a SQL database. This turns out to be exceedingly whizzy! I wrote a few blog posts about SQL a while back as I learnt about it and this is my first serious attempt to use it. Essentially SQL allows you to ask nearly human language looking questions of big datasets, like this:
USE sciencemuseum;
SELECT collection,
COUNT(collection)
FROM sciencemuseum.objects
GROUP BY collection
ORDER BY COUNT(collection) DESC
LIMIT 0, 11000;
This gets you a list of all the collections inside the Science Museums catalogue (there are 162) and tells you how many objects are in each of these collections. Collections have names like “SRM – Acoustics” and “NRM – Railway Timepieces”, the NMSI incorporates the National Railway Museum (NRM), and the National Media Museum (NMEM) as well as the Science Museum (SCM) – hence the first three letters of the collection name. I took the collection data and fed it into Many Eyes to make a bubble chart:
The size of the bubble shows you how many objects are in a particular collection, you can see a majority of the major collections are medical related. So what’s in these collections? As well as longer descriptions, many objects are classified into a more limited number of types. This bubble chart shows the number of objects of each type:
This is where we learn that the Science Museum is inordinately fond of bottles (or jars, or specimen jars, or albarello’s or “shop rounds”). There are also a lot of prints and posters, from the National Railway Museum. This highlights a limitation to this type of approach: the fact that there are many of an object tells you little. It perhaps tells you how pervasive medicine has been in science – it is the visible face of science and has been for many years.
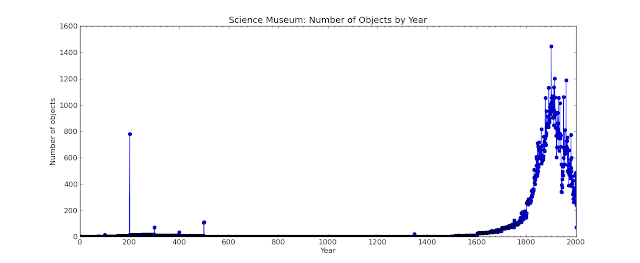
I have also plotted when the objects in the collection were made:
This turns out to be slightly tricky since over the years different curators have had different ideas about how *exactly* to describe the date when an object was made. Unsurprisingly in the 19th century they probably didn’t consider that a computer would be able to process 200,000 records in 1/4 second but simultaneously be unable to understand that circa 1680, c. 1680, c1680, ca 1680 and ca. 1680 actually all mean the same thing. This shows a number of objects in the first few centuries AD, followed by a long break and gradual rise after 1600 – the period of the Scientific Revolution. The pace picks up once again at the beginning of the 19th century.
I also made a crack at plotting where all the objects originating in the UK came from, on PC this is a live Google Map and is zoomable, beneath the red bubbles are disks sized in proportion to the number of objects from that location:
From this I learnt that there was a Pilkingtons factory in St Asaph, and a man in Chirk made railway models. To me this is the value of programming, the compilers of the catalogue made decisions as to what they included but once in my hands I can look into the catalogue according to my interests. I can explore in my own way, if I were a better programmer I could perhaps present you with a slick interface to do the same.
Finally for this post, I tried to plot when the objects arrived at the museum, this was a bit tricky: for about 60% of the objects the object reference number for objects contains the year as the first four characters so I just have the data for these:
The Science Museum started in 1857, the enormous spike in 1889 is due to the acquisition of the collection of Sir John Percy on his death, I discovered this on the the Science Museum website. Actually, I’d like to commend the whole Science Museum site to you, it’s very nice.
I visited the Science Museum a number of times in my childhood, I must admit to preferring it to the Natural History Museum, which seemed to be overwhelming large. The only record I have of these visits is this picture of a German Exchange visit to the museum, in 1985:
I must admit to not being a big fan of museums and galleries, they make my feet ache and I can’t find what I’m looking for or I don’t know what I’m looking for, and there never seems to be enough information on the things I’m looking at. This adventure into the data is my way of visiting a museum, I think I’ll spend a bit more time in wandering around the museum.
I had an alternative title for people who had never heard of J.B.S. Haldane: “It’s full of jars”
Footnote
If the Many Eyes visualisation above don’t work, you can see them in different formats from my profile page.


