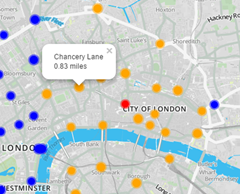
 There are tube strikes planned for 25th August 2015 and 28th August 2015 with disruption through the week. The nature of the London Underground means that it is not all obvious that walks between stations can be quite short. This blog post introduces a handy tool to help you work out “Can I walk it?”
You can find the tool here:
To use it start by selecting the station you want to walk from, either by using the “Where am I?” dropdown or by clicking one of the coloured station symbols (or close to it). The map will then refresh, the station you selected is marked by a red disk, the stations within 1.5 miles of the starting station are marked by an orange disk and those more than 1.5 miles away are marked by a blue disk. 1.5 miles is my “walkable” threshold, it takes me about 25 minutes to walk that far. You can enter your own “walkable” threshold in the “I will walk” box and press refresh or select a new starting station to refresh the map.
The station markers will show the station names on mouseover, and the distances to the starting station once it has been selected.
This tool comes with no guarantees, the walking distances are estimated and these estimates may be faulty, particularly for river crossings. Weather conditions may make walking an unpleasant or unwise decision. The tool relies on the user to supply their own reasonable walking threshold. Your mileage may vary.
To give a little background to this project: I originally made this tool using Tableau. It was OK but tied to the Tableau Public platform. I felt it was a little slow and unresponsive. It followed some work I’d done visualising data relating to the London Underground which you can read about here.
As an exercise I thought I’d try to make a “Can I walk it?” web application, re-writing the original visualisation in JavaScript and Python. I’ve been involved with projects like this at ScraperWiki but never done the whole thing for myself. I used the leaflet.js library to provide the mapping, the Flask library in Python to serve the data, Boostrap to make it look okay and Docker containers on Digital Ocean to deploy the application.
The underlying data for this tool comes from Open Street Map, where the locations of all the London Underground stations are encoded as latitude and longitude. With this information in hand it is possible to calculate the distances between stations. Really I want the “walking distance” between stations rather than the crow flies distance which is what this data gives me. Ideally to get the walking distance I’d use Google Directions API but unfortunately this has a rate limit of 2500 calls per day and I need to make about 36000 calls to get all the data I need!
The code is open source and available in this BitBucket repository:
https://bitbucket.org/ian_hopkinson/london-underground-app
Comments and feedback are welcome!
