Category: Book Reviews

Reviews of books featuring a summary of the book and links to related material

Book review: Tableau 8 – the official guide by George Peck

tableau 8 guideThis review was first published at ScraperWiki.

A while back I reviewed Larry Keller’s book The Tableau 8.0 Training Manual, at the same time I ordered George Peck’s book Tableau 8: the official guide. It’s just arrived. The book comes with a DVD containing bonus videos featuring George Peck’s warm, friendly tones and example workbooks. I must admit to being mildly nonplussed at receiving optical media, my ultrabook lacking an appropriate drive, but I dug out the USB optical drive to load them up. Providing an online link would have allowed the inclusion of up to date material, perhaps covering the version 8.1 announcement.

Tableau is a data visualisation application, aimed at the business intelligence area and optimised to look at database shaped data. I’m using Tableau on a lot of the larger datasets we get at ScraperWiki for sense checking and analysis.

Colleagues have noted that analysis in Tableau looks like me randomly poking buttons in the interface. From Peck’s book I learn that the order in which I carry out random clicking is important since Tableau will make a decision on what you want to see based both on what you have clicked and also its current state.

To my mind the heavy reliance on the graphical interface is one of the drawbacks of Tableau, but clearly, to business intelligence users and journalists, it’s the program’s greatest benefit. It’s a drawback because capturing what you’ve done in a GUI is tricky. Some of the scripting/version control capability is retained since most Tableau files are in plain XML format with which a little fiddling is tacitly approved by Tableau – although you won’t find such info in The Official Guide. I’ve been experimenting with using git source control on workbook files, and it works.

If you’re interested in these more advanced techniques then the Tableau Knowledgebase is worth a look. See this article, for example, on making a custom colour palette. I also like the Information Lab blog, 5 things I wish I knew about Tableau when I started and UK Area Polygon Mapping in TableauThe second post covers one of the bug-bears for non-US users of Tableau: the mapping functionality is quite US-centric.

Peck covers most of the functionality of Tableau, including data connections, making visualisations, a detailed look at mapping, dashboards and so forth. I was somewhat bemused to see the scatter plot described as “esoteric”. This highlights the background of those typically using Tableau: business people not physical scientists, and not necessarily business people who understand database query languages. Hence the heavy reliance on a graphical user interface.

I particularly liked the chapters on data connections which also described the various set, group and combine operations. Finally I understand the difference between data blending and data joining: joining is done at source between tables on the same database whilst blending is done on data from different sources by Tableau, after it has been loaded. The end result is not really different.

I now understand the point of table calculations – they’re for the times when you can’t work out your SQL query. Peck uses different language from Tableau in describing table calculations. He uses “direction” to refer to the order in which cells are processed and “scope” to refer to the groups over which cell calculations are performed. Tableau uses the terms “addressing” and “partitioning” for these two concepts, respectively.

Peck isn’t very explicit about the deep connections between SQL and Tableau but makes sufficient mention of the underlying processes to be useful.

It was nice to see a brief, clear description of the options for publishing Tableau workbooks. Public is handy and free if you want to publish to all. Tableau Online presents a useful halfway house for internal publication whilst Tableau Server gives full flexibility in scheduling updates to data and publishing to a range of audiences with different permission levels. This is something we’re interested in at ScraperWiki.

The book ends with an Appendix of functions available for field calculations.

In some ways Larry Keller and George Peck’s books complement each other, Larry’s book (which I reviewed here) contains the examples that George’s lacks and George’s some of the more in depth discussion missing from Larry’s book.

Overall: a nicely produced book with high production values, good but not encyclopedic coverage.

Book Review: Backroom Boys by Francis Spufford

backroomboysElectronic books bring many advantages but for a lengthy journey to Trento a paper book seemed more convenient. So I returned to my shelves to pick up Backroom Boys: The Secret Return of the British Boffin by Francis Spufford.

I first read this book quite some time ago, it tells six short stories of British technical innovation. It is in the character of Empire of the Clouds and A computer called LEO.  Perhaps a little nationalistic and regretful of opportunities lost.

The first of the stories is of the British space programme after the war, it starts with the disturbing picture of members of the British Interplanetary Society celebrating the fall of a V2 rocket in London. This leads on to a brief discussion of Blue Streak – Britain’s ICBM, scrapped in favour of the American Polaris missile system. As part of the Blue Streak programme a rocket named Black Knight was developed to test re-entry technology from this grew the Black Arrow – a rocket to put satellites into space.

In some ways Black Arrow was a small, white elephant from the start. The US had offered the British free satellite launches. Black Arrow was run on a shoestring budget, kept strictly as an extension of the Black Knight rocket and hence rather small. The motivation for this was nominally that it could be used to gain experience for the UK satellite industry and provide an independent launch system for the UK government, perhaps for things they wished to keep quiet. Ultimately it launched a single test satellite into space, still orbiting the earth now. However, it was too small to launch the useful satellites of the day and growing it would require complete redevelopment. The programme was cancelled in 1971.

Next up is Concorde, which could probably be better described as a large, white elephant. Developed in a joint Anglo-French programme into which the participants were mutually locked it burned money for nearly two decades before the British part was taken on by British Airways who used it to enhance the prestige of their brand. As a workhorse, commercial jet, it was poor choice: too small, too thirsty, and too loud.

But now for something more successful! Long ago there existed a home computer market in the UK, populated by many and various computers. First amongst these early machines was the BBC Micro. For which the first blockbuster game, Elite, was written by two Cambridge undergraduates (David Braben and Ian Bell). I played Elite in one of its later incarnations – on an Amstrad CPC464. Elite was a space trading and fighting game with revolutionary 3D wireframe graphics and complex gameplay. And it all fitted into 22kb – the absolute maximum memory available on the BBC Micro. The cunning required to build multiple universes in such a small space, and the battles to gain a byte here and a byte there to add another feature are alien to the modern programmers eyes. At the time Acornsoft were publishing quite a few games but Elite was something different: they’d paid for the development which took an unimaginable 18 months or so and when it was released there was a launch event at Alton Towers and the game came out in a large box stuffed with supporting material. All of this was a substantial break with the past. Ultimately the number of copies of Elite sold for the BBC Micro approximately matched the number of BBC Micros sold – an apparent market saturation.

Success continues with the story of Vodaphone – one of the first two players in the UK mobile phone market. The science here is in radio planning – choosing where to place your masts for optimal coverage, Vodaphone bought handsets from Panasonic and base stations from Ericsson. Interestingly Europe and the UK had a lead over the US in digital mobile networks – they agreed the GSM standard which gave instant access to a huge market. Whilst in the US 722 franchises were awarded with no common digital standard.

Moving out of the backroom a little is the story of the Human Genome Project, principally the period after Craig Venter announced he was going to sequence the human genome faster than the public effort then sell it! This effort was stymied by the Wellcome Trust who put a great deal further money into the public effort. Genetic research has a long history in the UK but the story here is one of industrial scale sequencing, quite different from conventional lab research and the power of the world’s second largest private research funder (the largest is currently the Bill & Melinda Gates Foundation).

The final chapter of the book is on the Beagle 2 Mars lander, built quickly, cheaply and with the huge enthusiasm and (unlikely) fund raising abilities of Colin Pillinger. Sadly, as the Epilogue records the lander became a high velocity impactor – nothing was heard from it after it left the Mars orbiter which had brought it from the Earth.

The theme for the book is the innate cunning of the British, but if there’s a lesson to be learnt it seems to be that thinking big is a benefit. Elite, the mobile phone network, the Human Genome Project were the successes from this book. Concorde was a technical wonder but an economic disaster. Black Arrow and Beagle 2 suffered from being done on a shoestring budget.

Overall I enjoyed the Backroom Boys, it reminded me of my childhood with Elite and the coming of the mobile phones. It’s more a celebration than a dispassionate view but there’s no harm in that.

Book Review: Georgian London–Into the Streets by Lucy Inglis

GeorgianLondonI saw the gestation of Georgian London: Into the streets by Lucy Inglis, so now it is born – I had to buy it!

Lucy Inglis has been blogging about Georgian London for much of the last four years, and I have been reading since then. Her focus is the stories of everyday folk, little snippets from contemporary records surrounded by her extensive knowledge of the period.

The book starts with some scene settings, in particular the end of the Restoration (1660), the Plague (1665), the Great Fire of London (1666) and the Glorious Revolution (1688). These events shape the stage for the Georgian period which covers the years 1714 to 1837, named for the succession of King George’s who reigned through the period marked by the death of William IV (don’t ask me).

London is then covered geographically, using John Rocque’s rather fabulous 1746 map as ornamentation. What is obvious to even those such as myself who are broadly ignorant of the geography of London is how much smaller London was then. Areas such as Islington, which I consider to be in the heart of London were on the edge of the city at the time, rural locations with farming and so forth. The period saw a huge expansion in the city from a population of 500,000 at the beginning of the period to 1.5 million by 1831 which much of the growth occurring in the second half of the 18th century.

Georgian London is somewhat resistant to my usual style of “review” which involves combining the usual elements of review and a degree of summary to remind me of what I read. Essentially there is just too much going on for summarising to work! So I will try some sort of vague impressionistic views:

It struck me how the nature of poverty changed with urbanisation; prior to a move to the city the poor could rely to some extent on the support of their parish, moving to London broke these ties and, particularly for women supporting children, this led to destitution. Men could easily travel to find work, either back home or elsewhere – a women with a child couldn’t do this.

The role of the state was rather smaller than it is now, when the time came to build Westminster Bridge, there was no government funding but rather a series of lotteries. The prize for one of these was the Jernegan cistern, a wine container made from quarter of a ton of silver with a capacity of 60 gallons! Another indicator of the smaller size of the state was that in 1730 a quarter of state income was from tax on alcohol, much of it on gin. Currently alcohol duties account for about £10billion per year which is about 1.5% of the total government spending.

Businesswomen make regular appearances through the book, for example such as Elinor James who was the widow of a printer, Thomas James but published under her own name. She was both a speaker and a pamphleteer, working at the beginning of the 18th century. At the end of the century, the younger Eleanor Coade, was running a thriving business making artificial stone (Coade stone). She’d first come to London in 1769, with her mother, also Eleanor following the death of her father.

At the same time that a quarter of all government revenue came from alcohol duties, a quarter of all gin distillers were women. Alcohol caused many social problems, particularly in the second quarter of the 18th century, as recorded by Hogarth’s “Gin Line”. The vice of the upper classes in the second half of the 18th century was gambling.

The Tower of London housed exotic animals for many years, providing a money-raising visitor attraction through the Georgian period, only losing it status in 1835 on the creation of London Zoo in Regent’s Park. A few years earlier, in 1832, the Tower of London hosted 280 beasts of varying types but it was becoming clear it was an unsuitable location to keep animals. The British were also becoming more aware of animal cruelty, with animal baiting becoming less popular through the Georgian period – culminating with the Act to Prevent the Cruel and Improper Treatment in 1822, and the formation of the RSPCA a couple years later.

It seems useful to know that London’s first street numbers where introduced in 1708.

The voice of the book is spot-on, conversational but authoritative, providing colour without clumsiness. There are no footnotes but there are extensive notes at the end of the book, along with a bibliography. For someone trying to write a blog post like this, the index could do with extension!

It’s difficult to write a review of a book by someone you know, all I can say is that if I didn’t like it I would have not written this. Don’t just take it from me – see what the Sunday Sport thought!

Pevsner Architectural Guide – Liverpool by Joseph Sharples

Pevsner-LiverpoolI reach Pevsner’s Architectural Guide – Liverpool (additional material Joseph Sharples) by a somewhat winding route: I take the Merseyrail train to Liverpool; my normal route is changed and I must walk across the city; it turns out the buildings are spectacular; I take photos and then I want to know what I have photoed. This is where the Pevsner Guide enters the picture.

Sir Nickolaus Pevsner was a German born art historian who moved to the UK in 1933, he felt that the academic study of architecture in Britain was lacking, and furthermore there were was no convenient source of information on the many and wondrous buildings of the country. In 1945 he proposed a series of books: Buildings of England to address this lack. The series ultimately ran to 46 volumes, 32 written by Pevsner, a further 10 which he co-authored and 4 written by others.

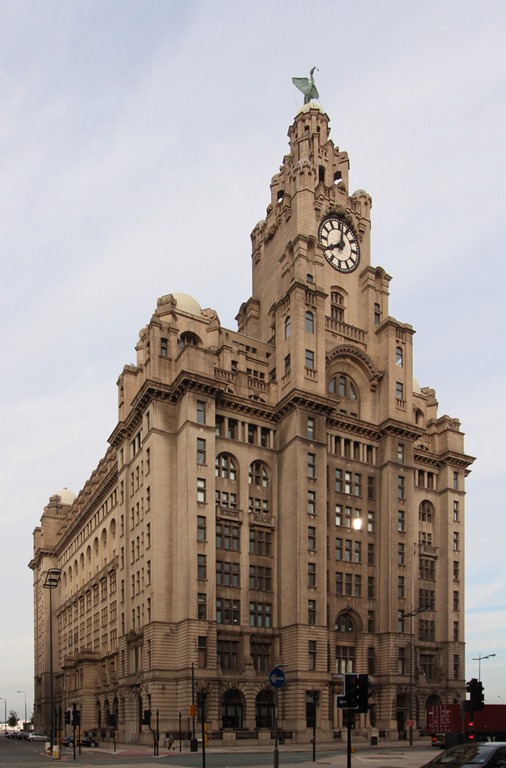
This Guide – Liverpool is a city specific reworking of the original guides. The book is large-pocket sized, well produced with a fair number of images. It starts with an overview of the history of Liverpool. I have to admit, shame-faced, that I was woefully ignorant of the city I now work in. For nearly 10 years I have lived just down the line in Chester, and yet I had visited Liverpool a handful of times, in the evening for works dinners. My perceptions of Liverpool are coloured by the time I grew up, in the 1980s, when Liverpool was host to riots in the Toxteth area of the city, mass unemployment and far-left politics. Walking around now what I see is completely at odds with my perceptions, you can see in my earlier post. To add some decoration to this post, below is the Royal Liver Building, one of the Three Graces, built on the waterfront at the beginning of the 20th century.

Royal Liver Building, corrected

Royal Liver Building, wide angle view with perspective “correction” applied

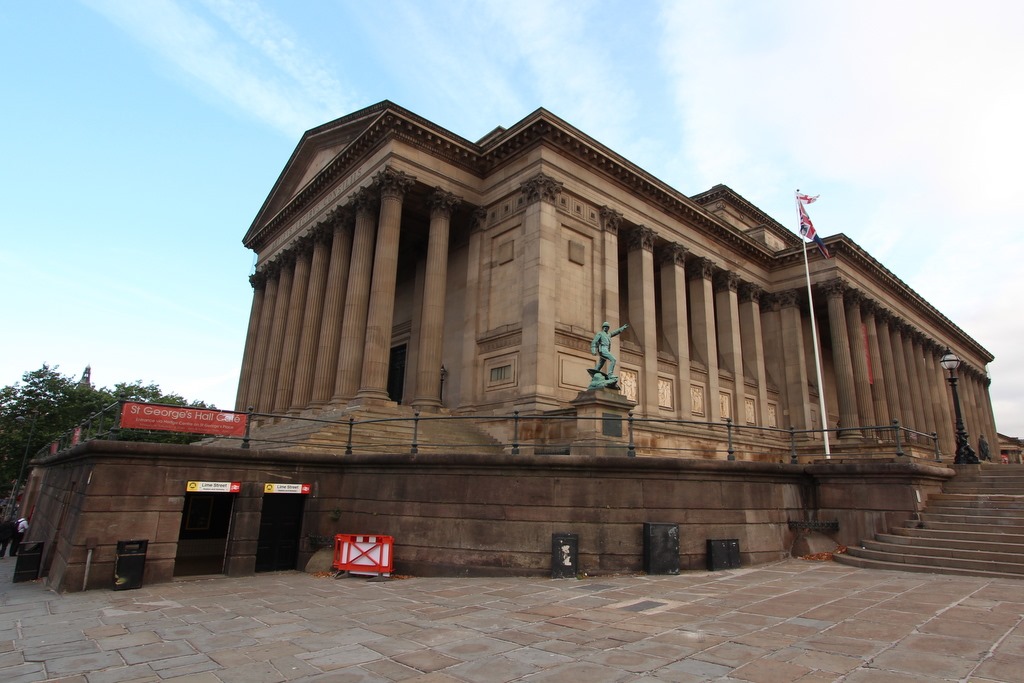
And St George’s Hall:

St George's Hall

St George’s Hall

Liverpool has long been Britain’s second port and probably has a strong claim for second city status (both following London). Initially it grew through exporting Cheshire salt, than as part of the triangle route carrying slaves, then as a point of exit for Britain’s manufactured goods and finally as a passenger terminus. Liverpool is not blessed with the best of conditions for shipping, this meant it was an early pioneer of gated docks. This was significant engineering work, only possible through the collective action of the city Corporation. It’s worth noting that one of the first railways in Britain was between Liverpool and Manchester, providing a link between the manufacturing centre and the port. Liverpool remained preeminent until the sixties when British manufacturing declined, and shipping became containerized, much reducing the labour required. It had no “second fiddle” so with the loss of shipping it went into rapid decline.

Nowadays Liverpool is making a resurgence, the fine buildings from its early high water mark are joined by some excellent new ones.

After a historical overview the Guide covers six major buildings / areas of the city: the Town Hall (dating to mid 18th century and the oldest major building in the city), St George’s Hall and the Plateau (up by Liverpool Lime Street Station); the William Brown Street Group and St. John’s Gardens; Pier Head where the outstanding Three Graces are to be found and finally the two cathedrals (Anglican and Catholic) both built in the 20th century. The majority of the buildings date from the latter half of the 19th century and early 20th century, the burgeoning wealth of the city having little time for preserving the relatively meagre past. The city suffered significant bombing during the Second World War, as a result of its importance as a port.

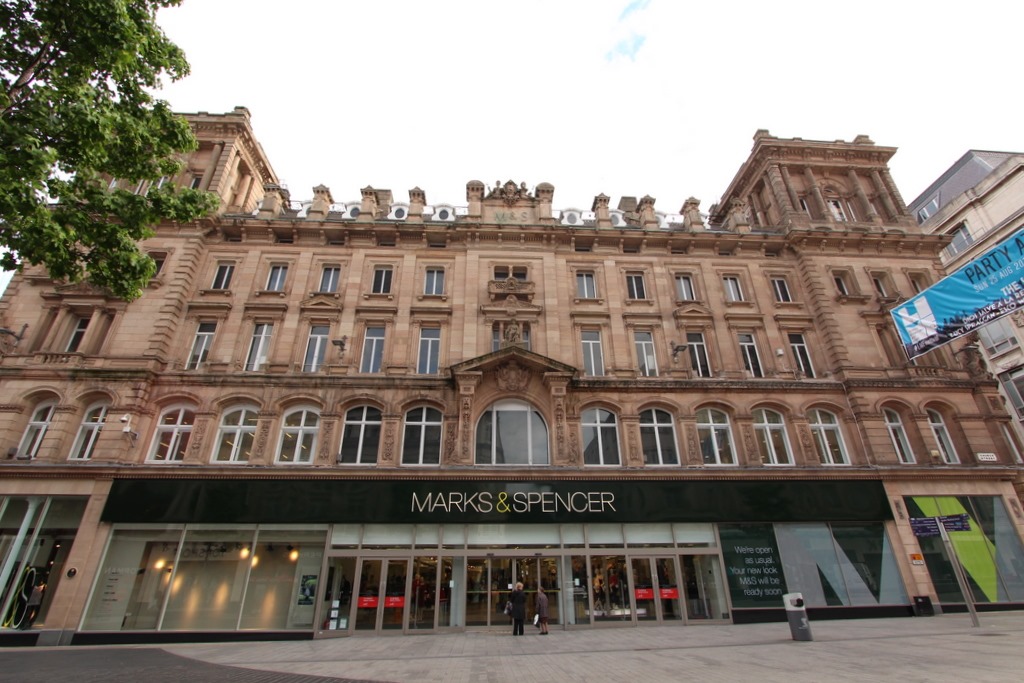
After the major buildings the remainder of the the Guide is broken down into a set of 10 walks around the central area of the city, spanning a few miles with an interlude covering the city centre. I’d spotted the grand building of the Marks & Spencer store in the centre of town on my previous perambulations, it is in fact Compton House (see below) built as one of the earliest department stores in 1867.


35 Church Street, Marks and Spencer

Compton House, Church Street


As a bonus the book finishes with three short pieces from areas outside the city: Speke Hall, Port Sunlight and Hamilton Square.

The Pevsner Guides are not really designed to be read sitting on the train, as I did, they are to be held as you walk around with a map. Despite the relatively large number of photos it doesn’t feel like enough, I was frustrated by reading the words but not being able to see the buildings. I think a few more walks with the camera are in order.

The Guide is a staccato recounting of what you can see, listing locations, architectural features, architects and the occasion blunt opinion, this is his comment on the re-development of the Prince’s Dock:

“The results so far, though, are inadequate. The architecture is both bland and overly fussy”

It feels like an excellent opportunity for a smartphone app. The current publishers seem a bit bewildered by this newfangled app world and have produced a digital companion in the form of a glossary of architectural terms. Elsewhere someone is selling a database of all of the Pevsner entries, the Guide is a database rendered in prose form.

It seems the components are there for a Pevsner App, who is with me in making it happen?

Footnote

Here‘s a Google Map of the Major Buildings from the Guide.

Book review: The Tableau 8.0 Training Manual – From clutter to clarity by Larry Keller

Tableau 8.0 Training Manual

This review was first published at ScraperWiki.

My unstoppable reading continues, this time I’ve polished off The Tableau 8.0 Training Manual: From Clutter to Clarity by Larry Keller. This post is part review of the book, and part review of Tableau.

Tableau is a data visualisation application which grew out of academic research on visualising databases. I’ve used Tableau Public a little bit in the past. Tableau Public is a free version of Tableau which only supports public data i.e. great for playing around with but not so good for commercial work. Tableau is an important tool in the business intelligence area, useful for getting a quick view on data in databases and something our customers use, so we are interested in providing Tableau integration with the ScraperWiki platform.

The user interface for Tableau is moderately complex, hence my desire for a little directed learning. Tableau has a pretty good set of training videos and help pages online but this is no good to me since I do a lot of my reading on my commute where internet connectivity is poor.

Tableau is rather different to the plotting packages I’m used to using for data analysis. This comes back to the types of data I’m familiar with. As someone with a background in physical sciences I’m used to dealing with data which comprises a couple of vectors of continuous variables. So for example, if I’m doing spectroscopy then I’d expect to get a pair of vectors: the wavelength of light and the measured intensity of light at those wavelengths. Things do get more complicated than this, if I were doing a scattering experiment then I’d get an intensity and a direction (or possibly two directions). However, fundamentally the data is relatively straightforward.

Tableau is crafted to look at mixtures of continuous and categorical data, stored in a database table. Tableau comes with some sample datasets, one of which is sales data from superstores across the US which illustrates this well. This dataset has line entries of individual items sold with sale location data, product and customer (categorical) data alongside cost and profit (continuous) data. It is possible to plot continuous data but it isn’t Tableau’s forte.

Tableau expects data to be delivered in “clean” form, where “clean” means that spreadsheets and separated value files must be presented with a single header line with columns which contain data all of the same type. Tableau will also connect directly to a variety of databases. Tableau uses the Microsoft JET database engine to store it’s data, I know this because for some data unsightly wrangling is required to load data in the correct format. Once data is loaded Tableau’s performance is pretty good, I’ve been playing with the MOT data which is 50,000,000 or so lines, which for the range of operations I tried turned out to be fairly painless.

Turning to Larry Keller’s book, The Tableau 8.0 Training Manual: From Clutter to Clarity, this is one of few books currently available relating to the 8.0 release of Tableau. As described in the title it is a training manual, based on the courses that Larry delivers. The presentation is straightforward and unrelenting; during the course of the book you build 8 Tableau workbooks, in small, explicitly described steps. I worked through these in about 12 hours of screen time, and at the end of it I feel rather more comfortable using Tableau, if not expert. The coverage of Tableau’s functionality seems to be good, if not deep – that’s to say that as I look around the Tableau interface now I can at least say “I remember being here before”.

Some of the Tableau functionality I find a bit odd, for example I’m used to seeing box plots generated using R, or similar statistical package. From Clutter to Clarity shows how to make “box plots” but they look completely different. Similarly, I have a view as to what a heat map looks like and the Tableau implementation is not what I was expecting.

Personally I would have preferred a bit more explanation as to what I was doing. In common with Andy Kirk’s book on data visualisation I can see this book supplementing the presented course nicely, with the trainer providing some of the “why”. The book comes with some sample workbooks, available on request – apparently directly from the author whose email response time is uncannily quick.