Category: Book Reviews

Reviews of books featuring a summary of the book and links to related material

Book review: Chasing Venus by Andrea Wulf

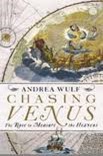
ChasingVenusI’ve been reading more of adventurous science of the Age of Enlightenment, more specifically Andrea Wulf’s book Chasing Venus: The Race to Measure the Heavens the scientific missions to measure the transit of Venus in 1761 and 1769.

Transits occur when a planet, typically Venus, lies directly between the earth and the Sun. During a transit Venus appears as a small black disc on the face of the sun. Since it’s orbit is also inside that of earth Mercury also transits the sun. Solar eclipses are similar but in this case the obscuring body is the moon, and since it is much closer to earth it completely covers the face of the sun.

Transits of Venus occur in pairs, 8 years apart separated by 100 or so years, they are predictable astronomical events. Edmund Halley predicted the 1761/1769 pair in 1716 and in addition proposed that the right type of observation would give a measure of the distance from the earth to the Sun. Once this distance is known distances of all the other planets from the sun can be calculated. In the same way as a solar eclipse can only be observed from a limited number of places on earth, the transit of Venus can only be observed from a limited number of places on earth. The observations required are the time at which Venus starts to cross the face of the sun, ingress, and the time at which it leaves, egress. These events are separated by several hours. In order to calculate the distance to the sun observations must be made at widely separate locations.

These timings had to be globally calibrated: some one in, say, London, had to be able to convert the times measured in Tahiti to the time London. This amounts to knowing precisely where the measurement was made – it is the problem of the longitude. At this time the problem of the longitude was solved given sufficient time, for land-based locations. It was still a challenge at sea.

At the time of the 1761/69 transits globe spanning travel was no easy matter, when Captain Cook landed on Tahiti in 1769 his was only the third European vessel to have done so, other ships had arrived in the two previous years; travel to the East Indies although regular was still hazardous. Even travel to the far North of Europe was a challenge, similarly across Russia to the extremes of Siberia. Therefore much of the book is given over to stories of long, arduous travel not infrequently ending in death.

Most poignant for me was the story of Jean-Baptiste Chappe d’Auteroche who managed to observe the entirety of both transits in Siberia and California but died of typhus shortly after observing the lunar eclipse critical to completing the observations he had made of Venus. His fellow Frenchman, Guillaume Joseph Hyacinthe Jean-Baptiste Le Gentil, observed the first transit onboard a ship on the way to Mauritius (his measurements were useless), remained in the area of the Indian Ocean until the second transit which he failed to observe because of the cloud cover and returned to France after 10 years, his relatives having declared him dead and the Académie des Sciences ceasing to pay him, assuming the same. Charles Green, observing for the Royal Society from Tahiti with Captain Cook and Joseph Banks, died after falling ill in Jakarta (then Batavia) after he had made his observations.

The measurements of the first transit in 1761 were plagued by uncertainty, astronomers had anticipated that they would be able to measure the times of ingress and egress with high precision but found that even observers at the same location with the same equipment measured times differing by 10s of seconds. We often see sharp, static images of the sun but viewed live through a telescope the picture is quite different; particularly close to the horizon the view of the sun the sun boils and shimmers. This is a result of thermal convection in the earth’s atmosphere, and is known as “seeing”. It’s not something I’d appreciated until I’d looked at the sun myself through a telescope. This “seeing” is what caused the problems with measuring the transit times, the disk of Venus did not cross a sharp boundary into the face of the sun, it slides slowly into a turbulent mess.

The range of calculated earth-sun distances for the 1761 measurements was 77,100,000 to 98,700,000 miles which spans the modern value of 92,960,000 miles. This represents a 22% range. By 1769 astronomers had learned from their experience, and the central estimate for the earth-sun distance by Thomas Hornsby was 93,726,000 miles, a discrepancy of less than 1% compared to the modern value. The range of the 1769 measurements was 4,000,000 miles which is only 4% of the earth-sun distance.

By the time of the second transit there was a great deal of political and public interest in the project. Catherine the Great was very keen to see Russia play a full part in the transit observations, in England George III directly supported the transit voyages and other European monarchs were equally keen.

Chasing Venus is of the same theme as a number of books I have reviewed previously: The Measure of the Earth, The Measure of All Things, Map of a Nation, and The Great Arc. The first two of these are on the measurement of the size, and to a degree, the shape of the Earth. The first in Ecuador in 1735, the second in revolutionary France. The Great Arc and Map of a Nation are the stories of the mapping by triangulation of India and Great Britain. In these books it is the travel, and difficult conditions that are the central story. The scientific tasks involved are simply explained, although challenging to conduct with accuracy at the time they were made and technically complex in practice.

There is a small error in the book which caused me initial excitement, the first transit of Venus was observed in 1639 by Jeremiah Horrocks and William Crabtree, Horrocks being located in Hoole, Cheshire according to Wulf. Hoole, Cheshire is suburb of Chester about a mile from where I am typing this. Sadly, Wulf is wrong, Horrocks appears to have made his observations either at Carr House in Bretherton or Much Hoole (a neighbouring village) both in Lancashire and 50 miles from where I sit.

Perhaps unfairly I found this book a slightly repetitive list of difficult journeys conducted first in 1761, and then in 1769. It brought home to me the level of sacrifice for these early scientific missions, and indeed global trade, simply in the separation from ones family for extended periods but quite often in death.

Posting abroad: my book reviews at ScraperWiki

It’s been a bit quiet on my blog this year, this is partly because I’ve got a new job at ScraperWiki. This has reduced my blogging for two reasons, the first is that I am now much busier but the second is that I write for the ScraperWiki blog. I thought I’d summarise here what I’ve done there just to keep everything in one place.

There’s a lot of programming and data science in my new job , so I’ve been reading programming and data analysis books on the train into work. The book reviews are linked below:

I seem to have read quite a lot!

Related to this is a post I did on Enterprise Data Analysis and visualisation: An interview study, an academic paper published by the Stanford Visualization Group.

Finally, I’ve been on the stage – or at least presenting at a meeting – I spoke at Data Science London a couple of weeks ago about Scraping and Parsing PDF files. I wrote a short summary of the event here.

datavisualization_andykirk javascriptthegoodparts1 machinelearningcover interactivevisualisation natural-language-processing-with-python


rinaction

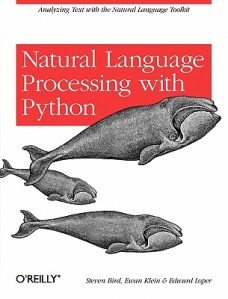
Book review: Natural Language Processing with Python by Steven Bird, Ewan Klein & Edward Loper

natural-language-processing-with-python

This post was first published at ScraperWiki.

I bought Natural Language Processing in Python by Steven Bird, Ewan Klein & Edward Loper for a couple of reasons. Firstly, ScraperWiki are part of the EU Newsreader Project which seeks to make a “history recorder” using natural language processing to convert large streams of news articles into a more structured form. ScraperWiki’s role in this project is to scrape open sources of news related material, such as parliamentary records and to drive exploitation of the results of this work both commercially and through our contacts in the open source community. Although we’re not directly involved in the natural language processing work it seems useful to get a better understanding of the area.

Secondly, I’ve recently given a talk at Data Science London, and my original interpretation of the brief was that I should talk a bit about natural language processing. I know little of this subject so thought I should read up on it, as it turned out no natural language processing was required on my part.

This is the book of the Natural Language Toolkit Python library which contains a wide range of linguistic resources, methods for processing those resources, methods for accessing new resources and small applications to give a user-friendly interface for various features. In this context “resources” mean the full text of various books, corpora(large collections of text which have been marked up to varying degrees with grammatical and other data) and lexicons (dictionaries and the like).

Natural Language Processing is didactic, it is intended as a text for undergraduates with extensive exercises at the end of each chapter. As well as teaching the fundamentals of natural language processing it also seeks to teach readers Python. I found this second theme quite useful, I’ve been programming in Python for quite some time but my default style is FORTRANIC. The authors are a little scornful of this approach, they present some code I would have been entirely happy to write and describe it as little better than machine code! Their presentation of Python starts with list comprehensions which is unconventional, but goes on to cover the language more widely.

The natural language processing side of the book progresses from the smallest language structures (the structure of words), to part of speech labeling, phrases to sentences and ultimately deriving logical statements from natural language.

Perhaps surprisingly tokenization and segmentation, the process of dividing text into words and sentences respectively is not trivial. For example acronyms may contain full stops which are not sentence terminators. Less surprisingly part of speech (POS) tagging (i.e. as verb, noun, adjective etc) is more complex since words become different parts of speech in different contexts. Even experts sometimes struggle with parts of speech labeling. The process of chunking – identifying noun and verb phrases is of a similar character.

Both chunking and part of speech labeling are tasks which can be handled by machine learning. The zero order POS labeller assumes everything is a noun, the next simplest method is a simple majority voting one which takes the POS tag for previous word(s) and assumes the most frequent tag for the current word based on an already labelled body of text. Beyond this are the machine learning algorithms which take feature sets, including the tags of neighbouring words, to provide a best estimate of the tag for the word of interest. These algorithms include Bayesian classifiers, decision trees and the like, as discussed in Machine Learning in Action which I have previously reviewed. Natural Language Processing covers these topics fairly briefly but provides pointers to take things further, in particular highlighting that for performance reasons one may use external libraries from the Natural Language Toolkit library.

The final few chapters on context free grammars exceeded the limits of my understanding for casual reading, although the toy example of using grammars to translate natural language queries to SQL clarified the intention of these grammars for me. The book also provides pointers to additional material, and to where the limits of the field of natural language processing lie.

I enjoyed this book and recommend it, it’s well written with a style which is just the right level of formality. I read it on the train so didn’t try out as many of the code examples as I would have liked – more of this in future. You don’t have to buy this book, it is available online in its entirety but I think it is well worth the money.

Book review: Empire of the Clouds by James Hamilton-Paterson

EmpireOfTheCloudsEmpire of the Clouds by James Hamilton-Paterson, subtitled When Britain’s Aircraft Ruled the World, is the story of the British aircraft industry in the 20 years or so following the Second World War. I read it following a TV series a while back, name now forgotten, and the recommendation of friend. I thought it might fit with the story of computing during a similar period which I had gleaned from A Computer called LEO. The obvious similarities are that at the end of the Second World War Britain held a strong position in aircraft and computer design, which spawned a large number of manufacturers who all but vanished by the end of the 1960s.

The book starts with the 1952 Farnborough Air Show crash in which 29 spectators and a pilot were killed when a prototype de Havilland 110 broke up in mid-air with one of its engines crashing into the crowd. Striking to modern eyes would be the attitude to this disaster – the show went on directly with the next pilot up advised to “…keep to the right side of the runway and avoid the wreckage”. All this whilst ambulances were still converging to collect the dead and wounded. This attitude applied equally to the lives of test pilots, many of whom were to die in the years after the war. Presumably this was related to war-time experiences where pilots might routinely expect to lose a large fraction of their colleagues in combat, and where city-dwellers had recent memories of nightly death-tolls in the hundreds from aerial bombing.

Some test pilots died as they pushed their aircraft towards the sound barrier, the aerodynamics of an aircraft change dramatically as it approaches the speed of sound, making it difficult to control and all at very high speed so if solutions to problems did exist they were rather difficult to find in the limited time available. Black box technology for recording what had happened was rudimentary so the approach was generally to try to creep up on the speeds at which others had come to grief with a hope of finding out what had gone wrong by direct experience.

At the end of the Second World War Britain had a good position technically in the design of aircraft, and a head start with the jet engine. There were numerous manufacturers across the country who had been churning out aircraft to support the war effort. This could not be sustainable in peace time but it was not for quite some time that the required rationalisation was to occur. Another consequence of war was that for resilience to aerial bombing manufacturers frequently had distributed facilities which in peacetime were highly inconvenient, these arrangements appeared to remain in place for some time after the war.

In some ways the sub-title “When Britain’s Aircraft Ruled the World” is overly optimistic, although there were many exciting and intriguing prototype airplanes produced but only a few of them made it to production, and even fewer were commercially, or militarily successful. Exceptions to this general rule were the English Electric Canberra jet-bomber, English Electric Lightning, Avro Vulcan and the Harrier jump jet.

The longevity of these aircraft in service was incredible: the Vulcan and Canberra were introduced in the early fifties with the Vulcan retiring in 1984 and the Canberra lasting until 2006. The Harrier jump jet entered service in 1969 and is still operational. The Lighting entered service 1959 and finished in 1988; viewers of the recent Wonders of the Solar System will have seen Brian Cox take a trip in a Lightning, based at Thunder City where thrill-seekers can play to fly in the privately-owned craft. They’re ridiculously powerful but only have 40 minutes or so of fuel, unless re-fuelled in-flight.

Hamilton-Paterson’s diagnosis is that after the war the government’s procurement policies, frequently finding multiple manufacturers designing prototypes for the same brief and frequently cancelling those orders, were partly to blame for the failure of the industry. These cancellations were brutal: not only were prototypes destroyed, the engineering tools used to make them were destroyed. This is somewhat reminiscent of the decommissioning of the Colossus computer at the end of the Second World War. In addition the strategic view at the end of the war was that there would be no further wars to fight for the next ten years and development of fighter aircraft was therefore slowed. Military procurement has hardly progressed to this day, as a youth I remember the long drawn out birth of the Nimrod reconnaissance aircraft, and more recently there have been mis-adventures with the commissioning of Chinook helicopters and new aircraft carriers.

A second strand to the industry’s failure was the management and engineering approaches common at the time in Britain. Management stopped for two hours for sumptuous lunches every day, it was often autocratic. Whilst American and French engineers were responsive to the demands of their potential customers, and their test pilots the British ones seemed to find such demands a frightful imposition which they ignored. Finally, with respect to civilian aircraft, the state owned British Overseas Airways Corporation was not particularly patriotic in its procurement strategy.

Hamilton-Paterson’s book is personal, he was an eager plane-spotter as a child and says quite frankly that the test pilot Bill Waterson – a central character in the book – was a hero to him. This view may or may not colour the conclusions he makes about the period but it certainly makes for a good read, the book could have been a barrage of detail about each and every aircraft but the more personal reflections, and memories make it something different and more readable. There are parallels with the computing industry after the war, but perhaps the most telling thing is that flashes of engineering brilliance are of little use if they are not matched by a consistent engineering approach and the management to go with it.

Book review: Interactive Data Visualization for the web by Scott Murray

interactivevisualisation

This post was first published at ScraperWiki.

Next in my book reading, I turn to Interactive Data Visualisation for the web by Scott Murray (@alignedleft on twitter). This book covers the d3 JavaScript library for data visualisation, written by Mike Bostock who was also responsible for the Protovis library.  If you’d like a taster of the book’s content, a number of the examples can also be found on the author’s website.

The book is largely aimed at web designers who are looking to include interactive data visualisations in their work. It includes some introductory material on JavaScript, HTML, and CSS, so has some value for programmers moving into web visualisation. I quite liked the repetition of this relatively basic material, and the conceptual introduction to the d3 library.

I found the book rather slow: on page 197 – approaching the final fifth of the book – we were still making a bar chart. A smaller effort was expended in that period on scatter graphs. As a data scientist, I expect to have several dozen plot types in that number of pages! This is something of which Scott warns us, though. d3 is a visualisation framework built for explanatory presentation (i.e. you know the story you want to tell) rather than being an exploratory tool (i.e. you want to find out about your data). To be clear: this “slowness” is not a fault of the book, rather a disjunction between the book and my expectations.

From a technical point of view, d3 works by binding data to elements in the DOM for a webpage. It’s possible to do this for any element type, but practically speaking only Scaleable Vector Graphics (SVG) elements make real sense. This restriction means that d3 will only work for more recent browsers. This may be a possible problem for those trapped in some corporate environments. The library contains a lot of helper functions for generating scales, loading up data, selecting and modifying elements, animation and so forth. d3 is low-level library; there is no PlotBarChart function.

Achieving the static effects demonstrated in this book using other tools such as R, Matlab, or Python would be a relatively straightforward task. The animations, transitions and interactivity would be more difficult to do. More widely, the d3 library supports the creation of hierarchical visualisations which I would struggle to create using other tools.

This book is quite a basic introduction, you can get a much better overview of what is possible with d3 by looking at the API documentation and the Gallery. Scott lists quite a few other resources including a wide range for the d3 library itself, systems built on d3, and alternatives for d3 if it were not the library you were looking for.

I can see myself using d3 in the future, perhaps not for building generic tools but for custom visualisations where the data is known and the aim is to best explain that data. Scott quotes Ben Schniederman on this regarding the structure of such visualisations:

overview first, zoom and filter, then details on demand