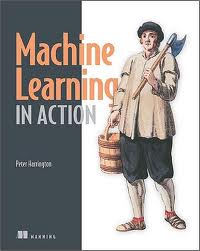
Book review: Machine Learning in Action by Peter Harrington

machinelearningcover

This post was first published at ScraperWiki.

Machine learning is about prediction, and prediction is a valuable commodity. This sounds pretty cool and definitely the sort of thing a data scientist should be into, so I picked up Machine Learning in Action by Peter Harrington to get an overview of the area.

Amongst the examples covered in this book are:

  • Given that a customer bought these items, what other items are they likely to want?
  • Is my horse likely to die from colic given these symptoms?
  • Is this email spam?
  • Given that these representatives have voted this way in the past, how will they vote in future?

In order to make a prediction, machine learning algorithms take a set of features and a target for a training set of examples. Once the algorithm has been trained, it can take new feature sets and make predictions based on them. Let’s take a concrete example: if we were classifying birds, the birds’ features would include the weight, size, colour and so forth and the target would be the species. We would train the algorithm on an initial set of birds where we knew the species, then we would measure the features of unknown birds and submit these to the algorithm for classification.

In this case, because we know the target – a species of bird – the algorithms we use would be referred to as “supervised learning.” This contrasts “unsupervised learning,” where the target is unknown and the algorithm is seeking to make its own classification. This would be equivalent to the algorithm creating species of birds by clustering those with similar features. Classification is the prediction of categories (i.e. eye colour, like/dislike), alternatively regression is used to predict the value of continuous variables (i.e. height, weight).

Machine learning in Action is divided into four sections that cover key elements and “additional tools” which includes algorithms for dimension reduction and MapReduce – a framework for parallelisation. Dimension reduction is the process of identifying which features (or combination of features) are essential to a problem.

Each section includes Python code that implements the algorithms under discussion and these are applied to some toy problems. This gives the book the air of Numerical Recipes in FORTRAN, which is where I cut my teeth on numerical analysis. The mixture of code and prose is excellent for understanding exactly how an algorithm works, but its better to use a library implementation in real life.

The algorithms covered are:

  • Classification – k-Nearest Neighbours, decision trees, naive Bayes, logistic regression, support vector machines, and AdaBoost;
  • Regression – linear regression, locally weighted linear regression, ridge regression, tree-based regression;
  • Unsupervised learning – k-means clustering, apriori algorithm, FP-growth;
  • Additional tools – principle component analysis and singular value decomposition.

Prerequisites for this book are relatively high: it assumes fair Python knowledge, some calculus, probability theory and matrix algebra.

I’ve seen a lot of mention of MapReduce without being clear what it was. Now I am more clear: it is a simple framework for carrying out parallel computation. Parallel computing has been around quite some time, the problem has always been designing algorithms that accommodate parallelisation (i.e. allow problems to be broken up into pieces which can be solved separately and then recombined). MapReduce doesn’t solve this problem but gives a recipe for what is required to run on commodity compute cluster.

As Harrington says: do you need to run MapReduce on a cluster to solve your data problem? Unless you are an operation on the scale of Google or Facebook then probably not. Current, commodity desktop hardware is surprisingly powerful particularly when coupled with subtle algorithms.

This book works better as an eBook than paper partly because the paper version is black and white and some figures require colour but the programming listings are often images and so the text remains small.

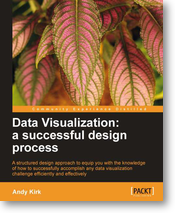
Book review: Data Visualization: a successful design process by Andy Kirk

datavisualization_andykirk

This post was first published at ScraperWiki.

My next review is of Andy Kirk’s book Data Visualization: a successful design process. Those of you on Twitter might know him as @visualisingdata, where you can follow his progress around the world as he delivers training. He also blogs at Visualising Data.

Previously in this area, I’ve read Tufte’s book The Visual Display of Quantitative Information and Nathan Yau’s Visualize ThisTufte’s book is based around a theory of effective visualisation whilst Visualize This is a more practical guide featuring detailed code examples. Kirk’s book fits between the two: it contains some material on the more theoretical aspects of effective visualisation as well as an annotated list of software tools; but the majority of the book covers the end-to-end design process.

Data Vizualisation introduced me to Anscombe’s Quartet. The Quartet is four small datasets, eleven (x,y) coordinate pairs in each. The Quartet is chosen so the common statistical properties (e.g. mean values of x and y, standard deviations for same, linear regression coefficients) for each set are identical, but when plotted they look very different. The numbers are shown in the table below.

anscombesdata

Plotted they look like this:

anscombequartetAside from set 4, the numbers look unexceptional. However, the plots look strikingly different. We can easily classify their differences visually, despite the sets having the same gross statistical properties. This highlights the power of visualisation. As a scientist, I am constantly plotting the data I’m working on to see what is going on and as a sense check: eyeballing columns of numbers simply doesn’t work. Kirk notes that the design criteria for such exploratory visualisations are quite different from those highlighting particular aspects of a dataset, more abstract “data art” presentations, or a interactive visualisations prepared for others to use.

In contrast to the books by Tufte and Yau, this book is much more about how to do data visualisation as a job. It talks pragmatically about getting briefs from the client and their demands. I suspect much of this would apply to any design work.

I liked Kirk’s “Eight Hats of data visualisation design” metaphor; which name the skills a visualiser requires: Initiator, Data Scientist, Journalist, Computer Scientist, Designer, Cognitive Scientist, Communicator and Project Manager. In part, this covers what you will require to do data visualisation, but it also gives you an idea of whom you might turn to for help  –  someone with the right hat.

The book is scattered with examples of interesting visualisations, alongside a comprehensive taxonomy of chart types. Unsurprisingly, the chart types are classified in much the same way as statistical methods: in terms of the variable categories to be displayed (i.e. continuous, categorical and subdivisions thereof). There is a temptation here though: I now want to make a Sankey diagram… even if my data doesn’t require it!

In terms of visualisation creation tools, there are no real surprises. Kirk cites Excel first, but this is reasonable: it’s powerful, ubiquitous, easy to use and produces decent results as long as you don’t blindly accept defaults or get tempted into using 3D pie charts. He also mentions the use of Adobe Illustrator or Inkscape to tidy up charts generated in more analysis-oriented packages such as R. With a programming background, the temptation is to fix problems with layout and design programmatically which can be immensely difficult. Listed under programming environments is the D3 Javascript library, this is a system I’m interested in using  –  having had some fun with Protovis, a D3 predecessor.

Data Visualization works very well as an ebook. The figures are in colour (unlike the printed book) and references are hyperlinked from the text. It’s quite a slim volume which I suspect compliments Andy Kirk’s “in-person” courses well.

Book review: The Dinosaur Hunters by Deborah Cadbury

DinosaurHuntersA rapid change of gear for my book reviewing: having spent several months reading “The Eighth Day of Creation” I have completed “The Dinosaur Hunters” by Deborah Cadbury in only a couple of weeks. Is this a bad thing? Yes, and no – it’s been nice to read a book that rattles along at a good pace, is gripping and doesn’t have me leaping to make notes at every page – the downside is that I feel I have consumed a literary snack rather than a meal.

The Dinosaur Hunters covers the initial elucidation of the nature of large animal fossils, principally of dinosaurs, from around the beginning of the 19th century to just after the publication of Darwin’s “Origin of the Species” in 1859. The book is centred around Gideon Mantell (1790-1852) who first described the Iguanodon and was an expert in the geology of the Weald, at the same time running a thriving medical practice in his home town of Lewes. Playing the part of Mantell’s nemesis is Richard Owen (1804-1892), who formally described the group of species, the Dinosauria, and was to be the driving force in the founding of the Natural History Museum in the later years of the 19th century. Smaller parts are played by Mary Anning (1799-1847), fossil collector based in Lyme Regis; William Buckland (1784-1856) who described Megalosaurus – the first of the dinosaurs and spent much of his life trying to reconcile his Christian faith with new geological findings; George Cuvier (1769-1832) the noted French anatomist who related fossil anatomy to modern animal anatomy and identified the existence of extinctions (although he was a catastrophist who saw this as evidence of different epochs of extinction rather than a side effect of evolution); Charles Lyell (1897-1875) a champion of uniformitarianism (the idea that the modern geology is the result of processes visible today continuing over great amounts of time); Charles Darwin (1809-1882) who really needs no introduction, and Thomas Huxley (1825-1895) a muscular proponent of Darwin’s evolutionary theory.

For me a recurring theme was that of privilege and power in science, often this is portrayed as something which disadvantaged women but in this case Mantell is something of a victim too, as was William Smith as described in “The Map that Changed the World”. Mantell was desperate for recognition but held back by his full-time profession as a doctor in a minor town and his faith that his ability would lead automatically to recognition. Owen, on the other hand, with similar background (and prodigious ability) went first to St Bartholomew’s hospital and then the Royal College of Surgeon’s where he appears to have received better patronage but in addition was also brutal and calculating in his ambition. Ultimately Owen over-reached himself in his scheming, and although he satisfied his desire to create a Natural History Museum, in death he left little personal legacy – his ability trumped by his dishonesty in trying to obliterate his opponents.

From a scientific point of view the thread of the book is from the growing understanding of stratigraphy i.e. the consistent sequence of rock deposits through Great Britain and into Europe; the discovery of large fossil animals which had no modern equivalent; the discovery of an increasing range of these prehistoric remnants each with their place in the stratigraphy and the synthesis of these discoveries in Darwin’s theory of evolution. Progress in the intermediate discovery of fossils was slow because in contrast to the the early fossils of marine species such as icthyosaurus and plesiosaurus which were discovered substantially intact later fossils of large land animals were found fragmented in Southern England, which made identifying the overall size of such species and even the numbers of species present in your pile of fossils difficult.

These scientific discoveries collided with a social thread which saw the clergy deeply involved in scientific discovery at the beginning, becoming increasingly discomforted with the account of the genesis of life in Scripture being incompatible with the findings in the stone. This ties in with a scientific community trying to make their discoveries compatible with Scripture and what they perceived to be the will of God with the schism between the two eventually coming to a head by the publication of Darwin’s Origin of Species.

Occasionally the author drops into a bit of first person narration which I must admit to finding a bit grating, perhaps because for people long dead it is largely inference. I’d have been very happy to have chosen this book for a long journey or a holiday, I liked the wider focus on a story rather than an individual.

References

My Evernotes

Book review: The Eighth Day of Creation by Horace Freeland Judson

EighthDayMy reading moves seamlessly from the origins of cosmology (in Koestler’s Sleepwalkers) to the origins of molecular biology in “The Eighth Day of Creation” by Horace Freeland Judson. The book covers the revolution in biology starting with the elucidation of the structure of DNA through to how this leads to the synthesis, by organisms, of proteins – this covers a period from just before the Second World War to the early 1960s although in the Epilogue and Afterwords. Judson comments on the period up to the mid-nineties. Although the book does provide basic information on the core concepts (What is DNA? What is a protein?), I suspect it requires a degree of familiarity with these ideas to make much sense on a casual reading – the same applies to this blog post.

The first third or so of the book covers the elucidation of the structure of DNA. Three groups were working on this problem – that of Linus Pauling in the US, Franklin and Wilkins at Kings College in London and Crick and Watson in Cambridge. Key to the success of Crick and Watson was their collaboration: a willingness to talk to people who knew stuff they needed to know, and piecing the bits together. The structural features of their model were the helix form (this wasn’t news), specific and strong hydrogen bonding between bases, and the presence of two DNA chains (running in opposite directions). On the whole this wasn’t a new story to me, although I wasn’t familiar with the surrounding work which established DNA as the genetic material. Judson returns to the part Rosalind Franklin in the discovery in one of the Afterwords. It has been said that Franklin was greatly wronged over the discovery of DNA, but Judson does not hold this view and I tend to agree with him. The core of the problem is that the Nobel Prize is not awarded posthumously, and with her death at 37 from cancer, Franklin therefore missed out. Watson’s book The Double Helix was a rather personalised view of the characters involved most of whom were alive to carry out damage limitation, whilst Franklin was not – so here she was poorly treated but by Watson rather than a whole community of scientists. Perhaps the thing that said the most to me about the situation is that after she was diagnosed with cancer she stayed with Cricks at their home.

In parallel with the elucidation of the structure of the DNA work had been ongoing with understanding protein synthesis and genetics in viruses and bacteria. This included both how information was coded into DNA, with much effort expended in trying to establish overlapping codes. There are 20 amino acids and four bases in DNA, so three base pairs are required to specify an amino acid if the amino acid sequence is to be unconstrained but it was conceivable that two consecutive amino acids are coded by fewer than 6 base pairs but in this case there is a restriction on the possible amino acid sequences. This area was initiated by the physicist, George Gamow. I struggle a bit to see how it gained so much traction, this type of model was quickly ruled out by consideration of the amino acid sequences that we being established for proteins at the time. It turns out that amino acids are coded by three consecutive base pairs with redundancy (so several different base pair triplets code for the same amino acid). Also covered was the mechanism by which data passed from DNA to the ribosomes where protein synthesis takes place, important here are adaptor molecules which carry the appropriate amino acid to the site of synthesis.

Compared to the structure of DNA this work was a long difficult slog, involving intricate experiments with bacteria, bacteriophage viruses, bacterial sex, ultracentrifugation, chromatography and radiolabelling.

The final part of the book is on the elucidation of the structure of proteins, this was done using x-ray crystallography with the very first clear scattering patterns measured in the 1930s and the first full elucidation made in the late fifties. X-ray crystallography of proteins, containing many thousands of atoms is challenging. Fundamentally there is a issue, the “phase problem”, which means you don’t have quite enough information to determine the structure from the scattering pattern. This issue was resolved by heavy atom labelling, here you try to chemically attach a heavy atom such as mercury to your protein then compare the scattering pattern of this modified protein with that of the unmodified protein, which resolves the phase problem. Nowadays measuring the thousands of spots in an x-ray scattering pattern and carrying out the thousands and thousands of calculations required to resolve the structure is relatively straightforward but in the early days it was a massive manual labour.

As well as resolving structure a key discovery was made regarding the mode of action of proteins: essentially they work as adaptors between chemical distinct systems – when a molecule binds to one site on a protein it effects the ability of another type of molecule to bind to another site on the protein through changes in the protein structure induced by the first molecule’s binding. This feature opens up huge possibilities for cell biology – in the absence of this feature interactions between chemical systems can only occur if the participants in those systems interact with each other chemically.

It isn’t something I’d really appreciated properly but molecular biologists are quite organised in the organisms that they generally agree to work on. The truth is that there are uncountably many viruses and so to aid the progress of science one needs to select which ones to study: E. Coli, the T series bacteriophages, C. Elegans, D. Melanogaster and more recently the zebrafish, they almost play the part of an extra author.

Molecular biology was apparently dominated by physicists, I must admit I found this confusing in the past but Judson highlights the field as defined by its practioners: biochemistry is about energy and matter (and typically small molecules), molecular biology is about information (and typically macromolecules) – a more natural home for physicists.

I found the first and third parts an enjoyable read, my scientific background is in scattering so the technical material was at least familiar the central section on genetics I found fascinating but a bit of a slog. I’m somewhat in awe of the complexity of the experiments (and their apparent difficulty).

Looking back on my earlier book reviews, I read my comment on R.J. Evan’s book on historiography that history is a literary exercise as well as anything else, as a trained scientist this was something of an alien concept but in common with Koestler’s book the style of this book shines through.


Footnotes

My Evernotes

Enterprise data analysis and visualization

This post was first published at ScraperWiki.

The topic for today is a paper[1] by members of the Stanford Visualization Group on interviews with data analysts, entitled “Enterprise Data Analysis and Visualization: An Interview Study”. This is clearly relevant to us here at ScraperWiki, and thankfully their analysis fits in with the things we are trying to achieve.

The study is compiled from interviews with 35 data analysts across a range of business sectors including finance, health care, social networking, marketing and retail. The respondents are harvested via personal contacts and predominantly from Northern California; as such it is not a random sample, we should consider results to be qualitatively indicative rather than quantitatively accurate.

The study identifies three classes of analyst whom they refer to as Hackers, Scripters and Application Users. The Hacker role was defined as those chaining together different analysis tools to reach a final data analysis. Scripters, on the other hand, conducted most of their analysis in one package such as R or Matlab and were less likely to scrape raw data sources. Scripters tended to carry out more sophisticated analysis than Hackers, with analysis and visualisation all in the single software package. Finally, Application Users worked largely in Excel with data supplied to them by IT departments. I suspect a wider survey would show a predominance of Application Users and a relatively smaller relative population of Hackers.

The authors divide the process of data analysis into 5 broad phases Discovery – Wrangle – Profile – Model – Report. These phases are generally self explanatory – wrangling is the process of parsing data into a format suitable for further analysis and profiling is the process of checking the data quality and establishing fully the nature of the data.

This is all summarised in the figure below, each column represents an individual so we can see in this sample that Hackers predominate.

table

At the bottom of the table are identified the tools used, divided into database, scripting and modeling types. Looking across the tools in use SQL is key in databases, Java and Python in scripting, R and Excel in modeling. It’s interesting to note here that even the Hackers make quite heavy use of Excel.

The paper goes on to discuss the organizational and collaborative structures in which data analysts work, frequently an IT department is responsible for internal data sources and the productionising of analysis workflows.

Its interesting to highlight the pain points identified by interviewees and interviewers:

  • scripts and intermediate data not shared;
  • discovery and wrangling are time consuming and tedious processes;
  • workflows not reusable;
  • ingesting semi-structured data such as log files is challenging.

Why does this happen? Typically the wrangling scraping phase of the operation is ad hoc, the scripts used are short, practioners don’t see this as their core expertise and they’ll typically draw from a limited number of data sources meaning there is little scope to build generic tools. Revision control tends not to be used, even for the scripting tools where it is relatively straightforward perhaps because practioners have not been introduced to revision control or simply see the code they write as too insignificant to bother with revision control.

ScraperWiki has its roots in data journalism, open source software and community action but the tools we build are broadly applicable, as one of the respondents to the survey said:

“An analyst at a large hedge fund noted their organization’s ability to make use of publicly available but poorly-structured data was their primary advantage over competitors.”

References

[1] S. Kandel, A. Paepcke, J. M. Hellerstein, and J. Heer, “Enterprise Data Analysis and Visualization : An Interview Study,” IEEE Trans. Vis. Comput. Graph., vol. 18(12), (2012), pp. 2917–2926.