Tag: politics

More news from the shed…

CWACResults2011

In the month of May I seem to find myself playing with maps and numbers.

To the uninvolved this may appear to be rather similar to my earlier “That’s nice dear”, however the technology involved here is quite different.

This post is about extracting the results from the local elections held on 5th May from the Cheshire West and Chester website and displaying them as a map. I could have manually transcribed the results from the website, this would probably be quicker, but where’s the fun in that?

The starting point for this exercise was noticing that the results pages have a little icon at the bottom saying “OpenElectionData”. This was part of an exercise to make local election results more easily machine-readable in order to build a database of results from across the country, somewhat surprisingly there is no public central record of local council election results. The technology used to provide machine access to the results is known as RDF (standing for Resource Description Framework), this is a way of providing “meaning” to web pages for machines to understand – this is related to the talk of the semantic web. The good folks at Southampton University have provided a browser which allows you to inspect the RDF contents of a webpage. I used this to get a human sight of the data I was trying to read.

RDF content ultimately amounts to triplets of information: “subject”,”predicate”,”object”. In the case of an election then one triplet has a subject of “specific ward identifier” the predicate is “a list of candidates” and the object is “candidate 1;candidate 2; candidate 3…”. Further triplets specify the whether a candidate was elected, how many votes they received and the party to which they belong.

I’ve taken to programming in Python recently, in particular using the Python(x,y) distribution which packages together an IDE with some libraries useful to scientists. This is the sort of thing I’d usually do with Matlab, but that costs (a lot) and I no longer have access to it at home.

There is a Python library for reading RDF data, called RDFlib, unfortunately most of the documentation is for version 2.4 and the working version which I downloaded is 3.0. Searching for documentation for the newer version normally leads to other sites where people are asking where the documentation is for version 3.0!

The base maps come from the Ordnance Survey, specifically the Boundary Line dataset which contains administrative boundary data for the UK in ESRI Shapefile format. This format is widely used for geographical information work, I found the PyShp library from GeospatialPython.com to be well-documented and straightforward way to read the format. The site also has some nice usage examples. I did look for a library to display the resulting maps but after a brief search I adapted the simple methods here for drawing maps using matlibplot.

The Ordnance Survey Open Data site is a treasure trove for programming cartophiles, along with maps of the UK of various types there’s a gazetteer of interesting places, topographic information and location data for UK postcode.

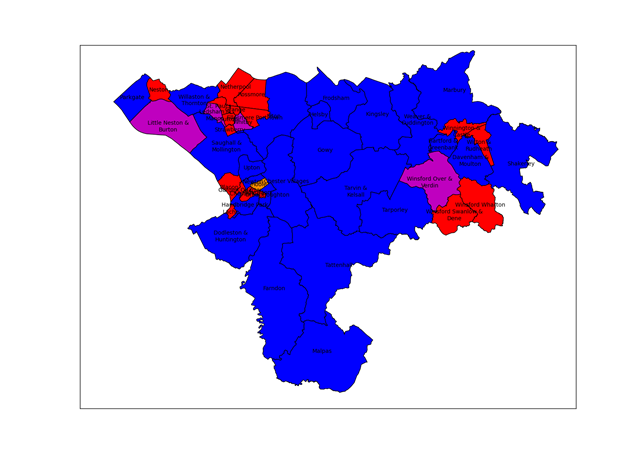
The map at the top of the page uses the traditional colour-coding of red for Labour and blue for Conservative, some wards elect multiple candidates and in those where the elected councillors are not all from the same party purple is used to show a Labour/Conservative combination and orange a Labour/Liberal Democrat combination.

In contrast to my earlier post on programming, the key elements here are the use of pre-existing libraries and data formats to achieve an end result. The RDF component of the exercise took quite a while, whilst the mapping part was the work of a couple of hours. This largely comes down to the quality of the documentation available. Python turns out to be a compact language to do this sort of work, it’s all done in 150 or so lines of code.

It would have been nice to have pointed my program to a single webpage and for it to find all the ward data from there, including the ward names, but I couldn’t work out how to do this – the program visits each ward in turn and I had to type in the ward names. The OpenElectionData site seemed to be a bit wobbly too, so I encoded party information into my program rather the pulling it from their site. Better fitting of the ward labels into the wards would have been nice too (although this is a hard problem). Obviously there’s a wide range of analysis that can be carried out on the underlying electoral data.

Footnotes

The python code to do this analysis is here. You will need to install the rdflib and PyShp libraries and download the OS Boundary Line data. I used the Python(x,y) distribution but I think it’s just the matlibplot library which is required. The CWac.py program extracts the results from the website and writes them to a CSV file, the Mapping.py program makes a map from them. You will need to adjust file paths to suit your installation.

Post-election Reflection 2011

A year into the Coalition and in the aftermath of some rather poor electoral results for the Liberal Democrats I thought I should write down some thoughts from the perspective of a Liberal Democrat of 20 years.

On May 5th the LibDems lost nearly 700 local councillors from an original population of 1751 and 9 of 19 councils, 12 of 17 seats were lost in the Scottish parliament and there was an emphatic “No to AV” in the referendum. At a personal level, I was involved in the campaign for the Cheshire West and Cheshire council, where ultimately we polled 12% of the votes and got 1.3% of the seats. This is a reduction from 4 seats to 1, although in a reconfigured council.

Why did this happen?

The LibDems were in a relatively good position based on the last occasion these council seats were contested, having steadily picked up seats from Labour through the years of Labour government 1997-2010, in particular from 2001 onwards. Our previous standing reflected a popular vote of around 23%, currently our opinion poll standings are around 15%.

In this sense it should not be seen as “electorate punishing LibDems for coalition” rather “former Labour supporters returning to Labour now it’s out of power”, similarly talk of LibDems being human shields for the Tories is not a particularly useful analysis. Tories and LibDems have different electorates, the Tory electorate is clearly happy with the Coalition, the LibDem electorate less so. Looking at the overall results with the Tories on 38% of the vote, Labour on 37% and LibDems 17%, we’re actually above the top end of our current opinion poll ratings with a share of the vote between our 1997 and 2001 general election result.

Also popular in the news is the idea that Nick Clegg must go as leader of the Liberal Democrats, if you rummage around amongst several hundred rather bruised (ex-)local councillors you are bound to find a few who’ll agree with this but it is idiocy for several reasons:

  • Nick Clegg got strong party backing for going into the Coalition from MPs, the federal executive and a special conference. We all stand with Nick, the idea that he has led the party off at the head of an Orange Book clique is a fantasy built by Labour, familiar with this type of internal schism.
  • Our drop in the opinion polls was pretty much inevitable as soon as the Coalition agreement was signed, regardless of anything any leader could have done: we dropped 2 points from the 23% showing at the election almost immediately, and then by mid-late summer were down to 18% even before the tuition fees issue had really hit.
  • A new leader at this point would continue to take the blame for simply being in coalition and leave us in no better position at the next general election.

The no to AV result was a disappointment, not because of the rejection of AV itself but because it likely rules out electoral reform for years to come. I thought Nick Clegg struck the best note on this, close to the end of the campaign when he said this was just a small change. I found Ed Miliband’s refusal to share a platform with Nick Clegg in support of the Yes campaign deeply unhelpful, listening to him try to justify this having just explained to John Humphries how AV forced politicians to reach out to other parties was entertaining; as was his jaw-dropping hypocrisy in justifying Labour’s failure to implement AV in 13 years of government as being because they’d won a 170 seat majority under first-past-the-post – remember this when he bleats about the “progressive majority”.

I note that over on ConHome the Tories are trying to claim that Labour made them make Nick Clegg the target for the No campaign. This seems to me a rather spineless statement – they funded the No to AV campaign, they could have called the shots. They should realise how massively they have pissed off a large chunk of pro-Coalition LibDems, and that there will be consequences for this. Going forward we should be looking at each item we have on the Coalition Agreement and asking ourselves: can we trust the Tories to support implementation of this? If the answer is “no” then we should be looking to bargain with something in the coalition agreement that they hold dear and not let it pass until our target has been achieved.

Obviously another election brings another crude pass at Liberal Democrat ministers by Ed Miliband, like a creepy uncle at a wedding party. This is entirely for his own supporters and has nothing to do with the Liberal Democrats, as Ed has said before – he seeks our extinction. We should all bear this in mind when he talks about “progressive alliances”.

I don’t see the point in believing that we can now go to the Tories for concessions because we have lost some elections, it seems needy and unnecessary to me. Similarly I don’t see much mileage in fiddling around with the infantile “getting into bed with” and “marriage” metaphors. Vince Cable and Chris Huhne have prototyped the “cooperating but sulkily” look and, to be frank, it is unedifying.

Liberal Democrats have succeeded in getting policy implemented over the past year in Coalition: in getting the income tax threshold raised, in linking pensions to earnings, in providing some protection to the poorest students through the Pupil Premium, in reducing the 28 days detention without charge to 14 days, in reducing dramatically, (if not entirely eliminating) child detention for failed immigration claimants. There is some interesting analysis by the University of Essex on how much of the Liberal Democrat manifesto got into the Coalition agreement. If you want to see a more detailed comparison here is a document on the Guardian Datablog which analyses, in detail the Coalition agreement. Or there is a document produced by the Party here.

Now is a bloody awful time to be in government, there is no money to spend on cherished schemes, rather an absolute need to cut pretty much the largest deficit in the world, left behind by a Labour government desperately trying to spend it’s way to salvation but we’re getting on and doing it. It’s worth remembering that at this point Labour would have been making 7/8ths of the cuts currently being made by the Coalition (under the Darling plan) – difficult to believe given their current statements.

Despite all of this, it is still the best time it has ever been to be a Liberal Democrat since I joined the party in 1991.

The elephant in the room

comparison

In my last blog post I wrote about the AV referendum and party political self-interest. Before that I wrote about AV, preference and how parties hold their internal elections.

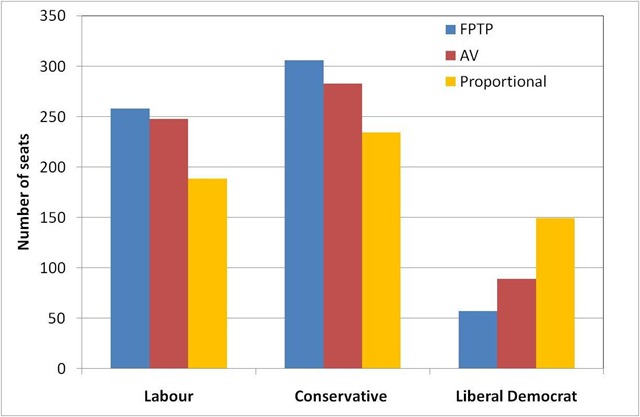
In this post I will just explain the chart at the top of the page.

It shows the number of parliamentary seats each of the three main national parties gained in the UK 2010 General Election under first-past-the-post (FPTP) – these are the blue bars. The red bars show the number of seats each party would expect to gain under Alternative Vote (AV), based on a mock election involving 13,000 people. Finally the yellow bars show the number of seats which would be obtained under a proportional system.

The proportional system, where the number of seats is proportional to the number of votes gained nationwide, is what I would call “fair”.

Labour and Tory parties both benefit significantly under the current FPTP system and proposed AV systems.

Self-interest and electoral perversions

In this post I will argue that all of the political parties are arguing the case for AV in their own self-interest, this is very obviously what they are doing and admitting such will make a change.

I’d like to start with the electoral system as it stands today:

Two things are going on at an a general election: there are “local” elections in 650 constituencies which determine which individual represents each constituency in parliament and then there is the government formed as the result of this set of elections. Once elected to parliament MP’s represent their constituents interests but vote largely as whipped by their political party.

First past the post (FPTP) and Alternative Vote (AV) are both algorithms for determining local representation: they make no deliberate effort to make the output of a collection of constituencies proportional to the proportion of votes cast for a particular party across the country. The degree to which they give proportionality is dependent on the spatial distribution of voters for each party across the country and the locations in which electoral boundaries are drawn1. The current distribution of party support is not far off the point where it can give completely perverse results with the Liberal Democrats gaining the largest fraction of the popular vote and the fewest parliamentary seats and Labour gaining the smallest fraction of the popular vote and the largest number of parliamentary seats2.

The FPTP system acts to supress the formation of more than two political parties, this is known as Duverger’s law. You can see this in action in the UK, with the separation of the SDP from Labour in the early 1980’s, gaining a large fraction of the popular vote: approaching that of Labour, but nothing like the same number of seats3.

Best estimates for AV in a UK general election are that the Liberal Democrats will gain seats in a Westminster election and Labour and the Tories will lose some, it isn’t particularly clear who will lose most.

So moving on to the self-interest of parties:

The Liberal Democrats are in favour of AV because they will get more seats, this is OK because they will still have far fewer seats than their proportion of the vote should allow.

The Tories are against AV because they believe that they will lose seats to the Liberal Democrats for the same share of the vote, and that Labour-Liberal Democrat coalitions are more likely than Tory-Liberal Democrat coalitions. Wait! What?

Labour is split on AV, this is because some believe that Labour-Liberal Democrat coalitions are more likely than Tory-Liberal Democrat coalitions, and the Tories could be basically locked out of power for ever. Others in Labour, on the left of the party, believe that the Socialist utopia should be pure and that coalition is anathema and so oppose AV.

UKIP is in favour of AV because they believe that they will be first preference for a number of people who vote Tory tactically and second preference for a number of Tories. Their visibility will rise, even if it doesn’t lead to much increase in seats.

The Greens are in favour of AV because they believe they will pick up second preferences from Liberal Democrats and Labour.Their visibility will rise, even if it doesn’t lead to increased seats.

The BNP is against AV because it judges that it will not pick up second preferences from anyone. It decreases the likelihood of them gaining seats even if it increases the visibility of the party. The BNP is entirely visible already but for the wrong reasons.

Oddly those on either side of the debate are able to draw on arguments that match the self-interest of their parties. What is the non-aligned voter to make of this?

Footnotes

  1. Oxford is a nice example of this: across the two Oxford parliamentary seats (Oxford East and Oxford West and Abdingon) the number of votes for the three main parties are (LibDem: 41087, Tory: 33633, Lab: 27937. The two constituencies return a Labour and a Tory MP.
  2. Don’t believe me? Put Tory: 33.2%, Labour: 27.2%, LibDem: 27.7% Other: 11.9% into this BBC seat calculator. The actual result was Tory: 36.1%, Labour: 29.0%, LibDem: 23.0% Other: 11.9%
  3. The 1983 General Election. Vote share: Tory: 42.4% Labour: 27.6% SDP+Liberal Alliance: 25.4% Number of seats: Tory: 397 Labour: 209 SDP+Liberal Alliance: 23.
  4. Given 1-3, on what basis is it that we claim to live in a democracy?

Yes to AV!

Alongside the local elections on the 5th May, we will all have an opportunity to vote in a referendum on voting reform*. The choice is between keeping the current system, First Past the Post (FPTP) or switching to the Alternative Vote (AV) system.

The Liberal Democrats use Single Transferrable Vote (STV) to elect their leaders. Labour uses straightforward AV. The Tories use a system to elect their leader which is substantially equivalent to AV: a ballot is taken with all candidates standing; if more than two candidates are standing then the last placed candidate is knocked-out and the ballot is repeated – this process is continued until only two candidates remain. In this two candidate election the candidate with most votes wins. The Tories could have used a straightforward FPTP system, but they didn’t: if they had then David Davies, not David Cameron, would have won the 2005 leadership election.

AV is substantially similar to this process of successive ballots but rather than a sequence of ballots, a single ballot is held with voters ranking candidates by preference. In common with the Tory system, the last candidate is eliminated after the first ballot but rather than return to the electorate for another round of voting the second preferences of the people who voted for the loser are inspected and votes redistributed accordingly. This process is repeated until one candidate has more than 50% of the votes.

The Tory leadership election is not identical to AV because the electorate can switch votes between rounds, whilst in an AV election the rankings are chosen and frozen at the time of the first (and only) ballot. With electorates of tens of thousands the Tory leadership system could not be used for parliamentary constituencies without substantially increased cost and time taken to conduct the election, I will assert that it would produce the same result as AV.

These political sophisticates have rejected FPTP as a method of choosing who represents them, why do so many of them not support the same for us?

AV will not bring great changes to our elections, the majority of constituencies would return the same MP under AV as they currently do under FPTP. The benefit of AV over FPTP is that tactical voting, where you attempt to encode your preferences with a single X by second guessing who everyone else will vote for, becomes largely irrelevant.

We are not being given a choice between FPTP and an ideal electoral system, we are not being asked whether AV is a perfect system for voting, we are being given a choice between FPTP and Alternative Vote. Personally I would prefer a system of proportional representation, but that isn’t on offer.

In the absence of a better choice I will vote “Yes to AV”!

*The BBC have apparently banned themselves from describing the choice of AV over FPTP as “reform”