
This post was first published at ScraperWiki.
My next review is of Andy Kirk’s book Data Visualization: a successful design process. Those of you on Twitter might know him as @visualisingdata, where you can follow his progress around the world as he delivers training. He also blogs at Visualising Data.
Previously in this area, I’ve read Tufte’s book The Visual Display of Quantitative Information and Nathan Yau’s Visualize This. Tufte’s book is based around a theory of effective visualisation whilst Visualize This is a more practical guide featuring detailed code examples. Kirk’s book fits between the two: it contains some material on the more theoretical aspects of effective visualisation as well as an annotated list of software tools; but the majority of the book covers the end-to-end design process.
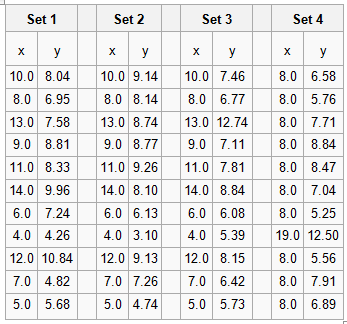
Data Vizualisation introduced me to Anscombe’s Quartet. The Quartet is four small datasets, eleven (x,y) coordinate pairs in each. The Quartet is chosen so the common statistical properties (e.g. mean values of x and y, standard deviations for same, linear regression coefficients) for each set are identical, but when plotted they look very different. The numbers are shown in the table below.
Plotted they look like this:
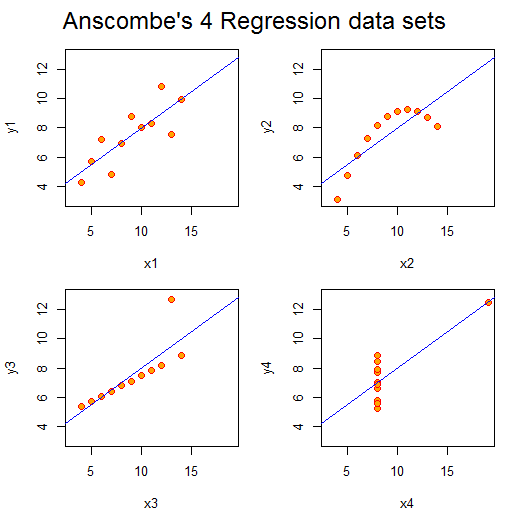 Aside from set 4, the numbers look unexceptional. However, the plots look strikingly different. We can easily classify their differences visually, despite the sets having the same gross statistical properties. This highlights the power of visualisation. As a scientist, I am constantly plotting the data I’m working on to see what is going on and as a sense check: eyeballing columns of numbers simply doesn’t work. Kirk notes that the design criteria for such exploratory visualisations are quite different from those highlighting particular aspects of a dataset, more abstract “data art” presentations, or a interactive visualisations prepared for others to use.
In contrast to the books by Tufte and Yau, this book is much more about how to do data visualisation as a job. It talks pragmatically about getting briefs from the client and their demands. I suspect much of this would apply to any design work.
I liked Kirk’s “Eight Hats of data visualisation design” metaphor; which name the skills a visualiser requires: Initiator, Data Scientist, Journalist, Computer Scientist, Designer, Cognitive Scientist, Communicator and Project Manager. In part, this covers what you will require to do data visualisation, but it also gives you an idea of whom you might turn to for help – someone with the right hat.
The book is scattered with examples of interesting visualisations, alongside a comprehensive taxonomy of chart types. Unsurprisingly, the chart types are classified in much the same way as statistical methods: in terms of the variable categories to be displayed (i.e. continuous, categorical and subdivisions thereof). There is a temptation here though: I now want to make a Sankey diagram… even if my data doesn’t require it!
In terms of visualisation creation tools, there are no real surprises. Kirk cites Excel first, but this is reasonable: it’s powerful, ubiquitous, easy to use and produces decent results as long as you don’t blindly accept defaults or get tempted into using 3D pie charts. He also mentions the use of Adobe Illustrator or Inkscape to tidy up charts generated in more analysis-oriented packages such as R. With a programming background, the temptation is to fix problems with layout and design programmatically which can be immensely difficult. Listed under programming environments is the D3 Javascript library, this is a system I’m interested in using – having had some fun with Protovis, a D3 predecessor.
Data Visualization works very well as an ebook. The figures are in colour (unlike the printed book) and references are hyperlinked from the text. It’s quite a slim volume which I suspect compliments Andy Kirk’s “in-person” courses well.
