Author's posts
Aug 11 2023
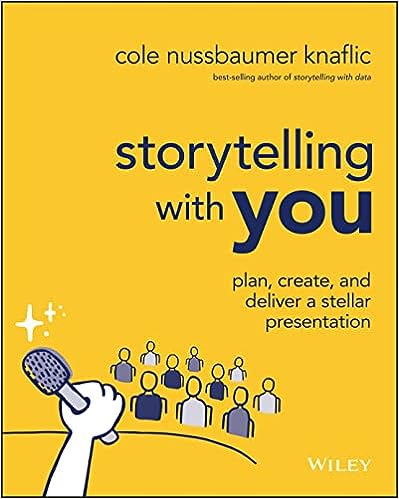
Book review: Storytelling with you by Cole Nussbaumer Knaflic
I recently reviewed Cole Nussbaumer Knaflic’s Storytelling with data, as a result the storytelling team sent me a copy of Storytelling with you to review. Storytelling with you is the next step in the journey which started with Storytelling with data, widening the scope to talk more fully about the whole process of presenting from inception to delivery and not being concerned specifically with presenting data.
I’m a data scientist, previously an academic and then industrial research scientist. Presenting has been a constant throughout my career, both as an audience member and as a presenter. Yet it is something in which I have had relatively little training and given the quality of the presentations I have witnessed – I am not alone!
Those with a scientific background will be used to a standard way of presenting results that effectively replicates a scientific paper (introduction, methodology, results, discussion, conclusions). Knaflic’s earlier book proposed a break from this format: using ideas from storytelling to shape presentations. She cites Resonate by Nancy Duarte, as a reference for this approach. Storytelling with you is similar in content to Resonate but feels like a shorter, more focussed book.
The book is divided into three parts: plan, create and deliver. Each part comprises four chapters. Each chapter ends with an instalment of the “TRIX Case study”. TRIX is a trail mix product which requires revision and the presentation is about options for this revision. I really liked this, it enables Knaflic to provide examples of the material in each chapter without having to restate the context for each new outing. I have learnt that macadamia nuts are really important to the TRIX mix!
Planning starts with the audience, not the content. Who are they? What do they want? I find Linkedin is great for getting a quick view of audience members. In terms of content the plan starts with the Big Idea – the sentence that captures what the presentation is about. This is expanded into a full story using a storyboard based on Post-its.
Knaflic is keen on Post-Its for planning and organising material. My tendency when creating a presentation is to open up a PowerPoint file but this forces me into choices on format and so forth that I don’t need to make at the beginning. There is also a challenge in being unwilling to delete slides so carefully and laboriously created!
The section on the theory of storytelling is quite brief. One takeaway for me was to think of the children’s books you know as templates for storytelling. Over the last 10 years or so I have read a lot to my son so I am very familiar with a range of children’s books. I like Dr Seuss, and Julia Donaldson’s books – The Gruffalo, for example – not only do they provide a template for stories, they are designed to be read aloud and provide some ideas for delivery. For fun, you can even think about your presentation in the style of Dr Seuss!
The create section is very practical, including a walkthrough of how to use PowerPoint-like Slide Master – I found this welcome since whilst I am aware of the master slides my use of them is rather primitive. It also talks about font selection, picking a font which has a distinct bold form, and colour selection.
The appendix containing the completed slides for the TRIX case study is quite telling when I compare them to my own: the case study slides contain far less text and effectively no bullet points when compared to mine. The story of the presentation is read from the titles which summarise the slide they sit on rather than indicating the function of the slide.
In terms of content I found the section on images most interesting, corporate templates tend to have a bunch of images included, and I always feel the need to add an image to each slide – which is wrong.
There is a substantial section on delivery. I found the part on introducing yourself quite striking, it talks about picking out the characteristics which you wish to present and relating anecdotes that support them. I found this a bit calculated but realise I probably do this intuitively – I am notorious for my anecdotes!
I was bemused by the vision of Knaflic striking power poses in conference centre restrooms in preparation for presenting! She provides a lot of detail on how she prepares to deliver a presentation. I learnt long ago that practicing the opening is very important, I find it helps me to relax. Knaflic points out that practicing your ending is equally important – it sends your audience off into action.
In common with Resonate and Storytelling with data the assumption is that you are preparing for a high stakes meeting and you are going to commit a lot of time to this process. Typically I find I make lots of low stakes presentations so there is a degree to which I would adapt the lessons in this book to that scenario. In fact the storytelling team have recognised this, and produced a blog post on a reduced process.
If you’re looking for a readable guide to planning, creating and delivering presentations then this is the book for you!
Aug 07 2023
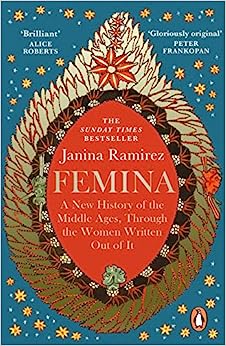
Book review: Femina by Janina Ramirez
In my history thread of reading, Femina by Janina Ramirez is up next. The subtitle, A New History of the Middles Ages, Through the Women Written Out of It, is as good a summary as one would like. Through nine chapters it relates the stories of women from the 7th century through to the 15th century. The earliest chapter relies entirely on archaeological evidence with later chapters mainly documentary but with some reference to historical objects.
The introductory chapter highlights that medieval women, such as Joan of Arc and Julian of Norwich influenced the suffragettes, so their existence was not unknown. It is fair to say that medieval women have not been subject of a huge amount of academic interest.
Subsequent chapters typically focus on one woman but include some material on other similar or related women. The chapters progress chronologically.
A recurring theme is the spread of the Catholic Church through the medieval period, and the role of women in that spread. First, bearing jewelry with secret Christian symbols but later as abbesses – in this period it seemed common for a monastery, for monks, and a convent, for nuns, to be paired. The position of abbess was quite senior, and providing an opportunity for study. The Reformation in the first half of the 16th century took away this route to power for women.
As is my custom I will provide a short summary of the chapters:
Movers and Shakers – the “Loftus princess burial” in North East England in the 7th century. It represents a transitional burial incorporating pre-Christian grave goods – in a Christian cemetery where grave goods are typically not found. It also considers the role of women like Queen Bertha of Kent and Hilda of Whitby in the development of the early Christian church in England.
Decision makers – the women of the British kingdoms prior to the “Viking” invasion in the second half of the 9th century. Cynethryth, Queen of the Mercians, features heavily – she ruled with her husband, Offa, until he died, and then in her own right. Cynethryth is unique as a women in England found on coinage of this period.
Warriors and Leaders – the Birka Warrior, a burial in a settlement near Stockholm – occupied for a period of 200 years. They were buried with weapons but were recently identified as a woman rather than a man. Obviously this caused some controversy but other sources suggest that there were at least some military women in this period and other burials on the site suggested that women were also tradespeople.
Artists and patrons – the Bayeux Tapestry, and the team of women believed to have made it – it turns out that it isn’t King Harold getting the arrow in the eye – once again my childhood history knowledge is false!
Polymaths and scientists – this chapter focusses on Hildegard of Bingen (1098-1179). She was an abbess and wrote widely on a range of topics including science and medicine as well as composing music. Her correspondence network included several popes.
Spies and Outlaws – the Cathars in southern France – who were subject to the Albigensian Crusade for heresy in the early 13th century. This was in a time when the Inquisition was only part-formed and local arrangements were more important than the central view. Women appear in the records of the Inquisition, and could be preachers in the Cathar religion.
Kings and diplomats – Jadwiga, the only female king of Poland, a member of the Europe-wide royal families. She introduced the Catholic Church to Poland, founded a University in Krakow, the first in Poland. She died following childbirth at the age of 26. In common with the Decision Makers chapter it shows how marriage was used as a tool of diplomacy in medieval Europe but with women playing some role in organising these partnerships – not simply pawns moved around a board by men.
Entrepreneurs and influencers – the chance survival of The Book of Margery Kempe – the first autobiography in English, written around 1440. Margery Kempe was from a relatively important family in Kings Lynn. She seems like quite a character, reporting a wide range of business enterprises, and religious visions as well as a pilgrimage to Jerusalem.
The final chapter touches on diversity, looking at the ethnicity of Londoners around the time of the Black Death – it shows (on the basis of 41 skeletons) that London in 1350 was about as diverse as modern London. There is also a single court account, elided in the official translation, relating to someone who might now be considered transgender.
Unrelated to gender, Femina highlights how cosmopolitan and connected medieval England was to Europe, and even Asia.
One thing that struck me from this book is that history is viewed through a glass darkly. Across the span of the 600 or so years from the latest of the women described in this book to the present day a great deal can happen. The first is that women are simply not written about, although this book shifts the balance a bit, it is clear were not generally considered the equals of men in the Middle Ages but they were more important than we perhaps currently believe.
More insidiously history is continually re-written by (usually) men with their own axe to grind, or simply a story to tell. An example of this is the “invention” of the Vikings in the 19th century, including their horned helmets which were popularised by a staging of The Ring of the Nibelung in 1876. The suppression of women’s stories started not long after the end of this book, in the 16th century or so.
This is without considering the amount of material simply lost over the span of 600 years.
I found Femina really readable, the chapters all start with some scene setting written in a more fictional style, the chapters provide self-contained stories – it is easy to see this being made into a TV series. I think the biggest takeaways for me were how important at least some women were in the Middle Ages, and how distorted our view of the past is by the historians (and wider society) of the intervening period.
Jul 10 2023
Book review: The Mythical Man-month by Frederick Brooks Jr.
 Next up The Mythical Man-Month: Essays on Software Engineering by Frederick Brooks Jr.
This is a classic in software engineering which I’ve not previously read, I guess because it is more about software project management rather than programming itself. That said it contains the best description I have seen as to why we love to program, it is a page long so I won’t quote it in full but essentially it divides into 5 parts.
- the joy of making things;
- the joy of making things which other people find useful;
- the joy of solving puzzles;
- the joy of learning;
- the joy of working in such a malleable medium;
The majority of the book was written in the mid-seventies, following the author’s experiences in the previous decade, delivering the IBM OS/360 system. This means it reads like Asimov’s Foundation in places, dated technology, dated prose, but at the same time insightful. This is the 20th anniversary edition, published in 1995 which includes 4 new chapters tacked on the end of the original book. Two of these – No Silver Bullet and No silver Bullet – refired are a couple of essays from the eighties around the idea that there are no silver bullets to making software production greatly more efficient – this is in the context of hardware improvements which were progressing at unimaginable speed – Brooks was looking for routes to similar evolution in software development.
The other two new chapters are a bullet point summary of the original book and a retrospective on the first publication. The bullet point summary chapter removes the need for my usual style of review!
The core of the book is the observation that large software projects frequently fail to be delivered as scheduled. There then follow some chapters on addressing this issue. The Mythical Man-Month chapter is the most famous of these, it essentially says the enticing idea of throwing more people at a problem will speed up delivery is wrong. In some cases this is trivially true – you may have seen the example from the book that two women do not produce a baby in 4.5 months rather than 9 months for a single woman. The reason increasing team numbers for software development similarly fails is the cost in time of effective communication between more people, and the cost in time of onboarding new people. Despite our knowledge we still routinely under-estimate programming tasks, largely through mis-placed optimism.
As mentioned above, The Mythical Man-Month is quite dated. The anachronisms come in several forms, there is the excitement over computer text-editing systems – a revelation at the time of OS/360 was being developed. There is a whole chapter devoted to memory/storage usage which I am pretty sure is no longer a concern except in a few niche cases. There is quite a lot of discussion of batch versus time share systems, from a time when there were one or maybe two computers in a building rather than one on every desk, even one in every pocket. There are role anachronisms, where a team has two secretaries and a "Program Clerk" whose role it is to type stuff into the computer!
There are some places where Brooks describes practices which sound quite modern but differ slightly differently to the current sense. So "architecture" in his parlance is more about interface design than "architecture" as we would describe it now. There is some pair-like programming but it has a leader and a follower rather than equals. Agile is mentioned but not in the modern sense.
I was interested to read Brooks disdain of flowcharts. I remember learning about these – including proper stencils from my father – a programmer trained in the early sixties. Brooks argument is that the flowchart is useful for programming in low-level languages like assembler but not useful for high level languages – particularly those using the "structured programming" approach which was new at the time. Structured programming replaces the GOTO statements found in earlier languages with blocks of code executed on if – then – else conditions and similar.
In a chapter entitled Plan to throw one away Brooks talks about the inevitability of the first iteration of a product being thrown away to be replaced by a better thought out version although he caveats this a little by allowing for progressive replacement. He notes that maintenance costs can be 40% of original cost and each new version fixing bugs has a 20% chance of introducing new bugs. This means the progressive replacement approach is a losing game.
In some ways this book is depressing, nearly 50 years after it was written software projects are still being delivered late with great regularity. On a more positive note I believe that the widespread availability of web APIs and online module libraries (such as PyPI for Python) can produce the sort of large uptick in programmer productivity that Brooks’ felt was out of reach. Perhaps this will not be seen as a productivity boost since it simply means the systems we aim to build are more complex and the number of lines of code measure of code does not capture the complexity of external libraries. The consistent user interfaces provided by Mac OS and Windows are also something Brooks was looking for in his original publication.
Is The Mythical-Man Month still worth reading? I’d say a qualified "yes", the issues it describes are still pertinent and it draws on quantitative research about teams of software developers which I believe will still be broadly relevant. It is a relatively short, easy to read, book. It gives a glimpse into the history of computing. On the downside, much of the incidental detail is so far out of date to be distracting.
Jun 08 2023
Book review: Masterminds of Programming by Federico Biancuzzi and Shane Warden
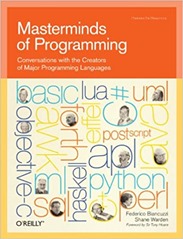 The next review in my work related books thread is of Masterminds of Programming by Federico Biancuzzi and Shane Warden. The subtitle, Conversations with the creators of major programming languages, is a good summary of the contents. The book is an edited transcript of interviews with the creators of major programming languages.
Frequently the conversation is with a single person but in a couple of cases two or even three people are interviewed. This is one small failing of the book because particularly where they interview three people the resulting chapter is very long and a bit repetitive.
There is a valid question to ask as to whether languages can be so closely tied to single individuals, and in the afterword the authors touch on this saying that one of the recurring themes was that the people they interviewed succeeded because they surrounded themselves with brilliant people. Some of these languages started off as one-man exercises but most grow from collective academic or corporate efforts, and even the one-man band languages developed a fairly formal community.
The languages covered are object-oriented languages (C++, Objective-C, Java, C# and Eiffel), functional languages (ML, Haskell, APL), glue languages originally designed to occupy the space between Unix and C (Awk, Lua, Python, Perl), languages designed for embedding (Forth and PostScript). Dartmouth Basic, SQL and UML are basically their own things. To be honest UML does not really fit into the book in my view since it is a formal design description language rather than an executable programming language. The languages were created between 1964 (Dartmouth BASIC) or maybe 1957 (for APL) and 2000 (C#).
I was sad to note the absence of a chapter on FORTRAN but John Backus, the inventor of FORTRAN died in 2007 – a couple of years before the book was written. Also there are no women interviewed in this book, a quick search reveals there are a number of programming languages invented or co-invented by women. COBOL, invented by Grace Hopper would be a prime candidate here but she died in 1992. Small Talk which inspired a lot of object-oriented languages was co-invented by Adele Goldberg and LOGO co-invented by Cynthia Solomon would fit rather well into the book.
The interviewers clearly had a set of questions which they asked each interviewee and the varying results indicate which questions chimed with the interests of the interviewee. The topics included concurrency, how to manage feature requests for languages, working in teams, debugging, software engineering and teaching.
The authors of the object-oriented languages (C++, Objective-C, Java, C# and Eiffel) are somewhat at each others throats. However, they are all pretty clear that object-orientation is the way forward for large software projects although they see encapsulation rather than inheritance or reuse as the key benefits it brings. There is a degree of condescension towards those languages that they perceived to have been successful as a result of marketing.
The authors of the functional programming languages are more interested in formal specification, I feel I should learn more about type theory. I have looked at Haskell in the past, and found it a bit challenging, however ideas from Haskell and other functional programming languages have made it into Python, my preferred language. The chapter on APL was entertaining, it was conceived and developed as a coherent formalised system for describing algebra the authors did not touch a computer for a number of years after “development” started in the mid-fifties. It is written as symbols which are challenging to enter on a conventional keyboard, you can see it in action here.
Tedd Codd’s relational database design was core to the success of SQL, and is largely why it has not been replaced. SQL was designed alongside IBM’s System R but Oracle produced the first commercial SQL engine.
I learnt a few random facts from the book which I can’t write as a coherent story:
- Charles H. Moore – author of Forth: “Legacy code may be the downfall of our civilisation”;
- Awk is an acronym of its authors names, Alfred Aho, Peter Weinberger and Brian Kernighan;
- Tom Love – co-author of Objective-C – “100,000 lines of code fills a box of paper and requires 2 people to maintain it. Test cases should be another two or three boxes.”!
The book would have really benefited from some sample code in each language, perhaps in the manner of Exercises in Programming Style which implements the same algorithm in different programming styles. I picked up Beautiful Code by Andy Oram and Greg Wilson, interviews with programmers, for my reading list. As well as The Mythical Man-month by Frederick P. Brooks, Jr which I probably should have read years ago.
I found this book really interesting, in part as a way of understanding how the programming languages I use every day of my working life came into being but also to understand the mindset of highly skilled programmers.
May 05 2023
Book review: Resonate by Nancy Duarte
 I picked up Resonate: Present Visual Stories That Transform Audiences by Nancy Duarte following a couple of recommendations in Storytelling with Data by Cole Nussbaumer Knaflic. You can see how Resonate influenced the storytelling elements of Knaflic’s book.
Resonate is about the importance of storytelling in making presentations, and a model to construct compelling presentations which will leave your audience primed to go off and take the action you want.
The book is beautifully produced, as you might expect from an author from a company which provides consulting on making presentations. In the front material Duarte mentions VisualStory(tm) and Presentation Form(tm) which are products from her company but through the rest of the book Duarte Design is scarcely mentioned.
The nine chapter titles make a pretty good summary of the book, I have added my own comments to clarify a bit:
- Why resonate? – audiences change when you make a personal connection with them, a presentation is not just about facts.
- Lessons from myths and movies – adding elements of storytelling makes a presentation much more impactful – people have been writing about the mechanics of storytelling for a couple of thousand years!
- Get to know the hero – the hero is the audience. In scriptwriting terms the hero goes on a well-defined journey and we are going to take the audience on a similarly structured journey. We tend to write presentation centred on ourselves, our companies and our products – they should be centred on the audience.
- Define the journey – you need to be clear about the intended outcome of your presentation, and make everything in your presentation about reaching that outcome.
- Create meaningful content – this is about compiling the content for your presentation, it includes a call to include personal stories and also to research your audience.
- Structure reveals insights – this is about structuring the content you’ve compiled. A lot of the structure of a presentation is about alternating between “what is” and “what could be”.
- Deliver something they’ll always remember – providing contrasts in presentational style and content to maintain interest.
- There is always room to improve – this chapter emphasises how much work successful presenters put into their presentation, both in initial preparation but also reflecting on performances.
- Change your world – this is largely a call to action for us to go out and do it!
There’s a final chapter called Inspiration is everywhere which has case studies on Mozart – how the sonata structure reflects a presentation structure, Alfred Hitchcock – how a presentation (or a film) is a well-planned collaborative endeavour and e.e. cummings – breaking the rules to get impact. There are a plenty of case studies spread through the book demonstrating how speakers structure compelling presentations, analysing them in terms of the model Duarte proposes. I liked the fact that the case studies included “people like me”, Richard Feynman – a physicist, and Marcus Covert – a biologist.
We’ve all heard of “this meeting could have been an email”, Duarte mentions at one point “this presentation could have been a report”. She sees a presentation as a platform to provoke action, produce change and a raw presentation of facts does not fit this definition – this could be a written report. I find a lot of the presentations I give fall into this category.
Resonate talks mainly in terms of high importance presentations: end of year reports to investors, presentations to win multi-million dollar research grants, Steve Jobs iphone presentation – big productions involving significant work, and a team of collaborators. It is up to the reader to determine how to make these ideas work for their own more modest circumstances.
I was also pleased that some elements that I include instinctively such as personal stories, and passion, and doing some research on my potential audience are recommended and effective. I think my change on reading Resonate will be more focus on The Big Idea and what I want the audience to do when they leave the presentation. There is also a strong indication that my slides should contain less text then I add – Duarte says that a single slide filled with text would take an audience 30 seconds to read, and they will either be reading your slide or listening to you, not both. She also says as a rule of thumb a slide should not be on screen for more than 2 minutes.
Overall, I’m glad I read this book – at times I found the style a bit grating but the content is thought-provoking. As a physical scientist I’m used to the idea that physical models are correct and can be proved. Duarte’s model of how to build and deliver a successful presentation is not a physical model – it is a framework for discussion and a source for new ideas.

