Category: Politics

Politics in the UK, with a Liberal Democrat (LibDem) slant

The elephant in the room

comparison

In my last blog post I wrote about the AV referendum and party political self-interest. Before that I wrote about AV, preference and how parties hold their internal elections.

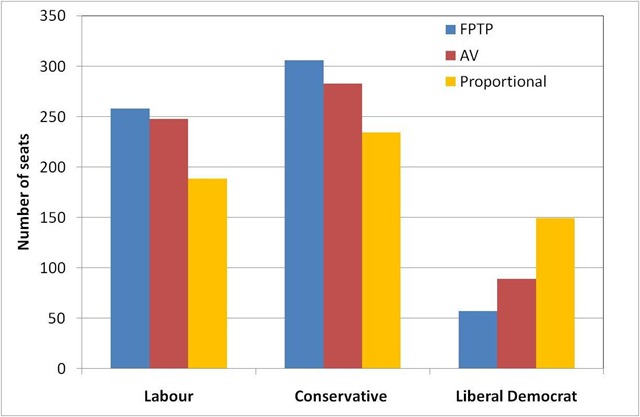
In this post I will just explain the chart at the top of the page.

It shows the number of parliamentary seats each of the three main national parties gained in the UK 2010 General Election under first-past-the-post (FPTP) – these are the blue bars. The red bars show the number of seats each party would expect to gain under Alternative Vote (AV), based on a mock election involving 13,000 people. Finally the yellow bars show the number of seats which would be obtained under a proportional system.

The proportional system, where the number of seats is proportional to the number of votes gained nationwide, is what I would call “fair”.

Labour and Tory parties both benefit significantly under the current FPTP system and proposed AV systems.

Self-interest and electoral perversions

In this post I will argue that all of the political parties are arguing the case for AV in their own self-interest, this is very obviously what they are doing and admitting such will make a change.

I’d like to start with the electoral system as it stands today:

Two things are going on at an a general election: there are “local” elections in 650 constituencies which determine which individual represents each constituency in parliament and then there is the government formed as the result of this set of elections. Once elected to parliament MP’s represent their constituents interests but vote largely as whipped by their political party.

First past the post (FPTP) and Alternative Vote (AV) are both algorithms for determining local representation: they make no deliberate effort to make the output of a collection of constituencies proportional to the proportion of votes cast for a particular party across the country. The degree to which they give proportionality is dependent on the spatial distribution of voters for each party across the country and the locations in which electoral boundaries are drawn1. The current distribution of party support is not far off the point where it can give completely perverse results with the Liberal Democrats gaining the largest fraction of the popular vote and the fewest parliamentary seats and Labour gaining the smallest fraction of the popular vote and the largest number of parliamentary seats2.

The FPTP system acts to supress the formation of more than two political parties, this is known as Duverger’s law. You can see this in action in the UK, with the separation of the SDP from Labour in the early 1980’s, gaining a large fraction of the popular vote: approaching that of Labour, but nothing like the same number of seats3.

Best estimates for AV in a UK general election are that the Liberal Democrats will gain seats in a Westminster election and Labour and the Tories will lose some, it isn’t particularly clear who will lose most.

So moving on to the self-interest of parties:

The Liberal Democrats are in favour of AV because they will get more seats, this is OK because they will still have far fewer seats than their proportion of the vote should allow.

The Tories are against AV because they believe that they will lose seats to the Liberal Democrats for the same share of the vote, and that Labour-Liberal Democrat coalitions are more likely than Tory-Liberal Democrat coalitions. Wait! What?

Labour is split on AV, this is because some believe that Labour-Liberal Democrat coalitions are more likely than Tory-Liberal Democrat coalitions, and the Tories could be basically locked out of power for ever. Others in Labour, on the left of the party, believe that the Socialist utopia should be pure and that coalition is anathema and so oppose AV.

UKIP is in favour of AV because they believe that they will be first preference for a number of people who vote Tory tactically and second preference for a number of Tories. Their visibility will rise, even if it doesn’t lead to much increase in seats.

The Greens are in favour of AV because they believe they will pick up second preferences from Liberal Democrats and Labour.Their visibility will rise, even if it doesn’t lead to increased seats.

The BNP is against AV because it judges that it will not pick up second preferences from anyone. It decreases the likelihood of them gaining seats even if it increases the visibility of the party. The BNP is entirely visible already but for the wrong reasons.

Oddly those on either side of the debate are able to draw on arguments that match the self-interest of their parties. What is the non-aligned voter to make of this?

Footnotes

  1. Oxford is a nice example of this: across the two Oxford parliamentary seats (Oxford East and Oxford West and Abdingon) the number of votes for the three main parties are (LibDem: 41087, Tory: 33633, Lab: 27937. The two constituencies return a Labour and a Tory MP.
  2. Don’t believe me? Put Tory: 33.2%, Labour: 27.2%, LibDem: 27.7% Other: 11.9% into this BBC seat calculator. The actual result was Tory: 36.1%, Labour: 29.0%, LibDem: 23.0% Other: 11.9%
  3. The 1983 General Election. Vote share: Tory: 42.4% Labour: 27.6% SDP+Liberal Alliance: 25.4% Number of seats: Tory: 397 Labour: 209 SDP+Liberal Alliance: 23.
  4. Given 1-3, on what basis is it that we claim to live in a democracy?

Yes to AV!

Alongside the local elections on the 5th May, we will all have an opportunity to vote in a referendum on voting reform*. The choice is between keeping the current system, First Past the Post (FPTP) or switching to the Alternative Vote (AV) system.

The Liberal Democrats use Single Transferrable Vote (STV) to elect their leaders. Labour uses straightforward AV. The Tories use a system to elect their leader which is substantially equivalent to AV: a ballot is taken with all candidates standing; if more than two candidates are standing then the last placed candidate is knocked-out and the ballot is repeated – this process is continued until only two candidates remain. In this two candidate election the candidate with most votes wins. The Tories could have used a straightforward FPTP system, but they didn’t: if they had then David Davies, not David Cameron, would have won the 2005 leadership election.

AV is substantially similar to this process of successive ballots but rather than a sequence of ballots, a single ballot is held with voters ranking candidates by preference. In common with the Tory system, the last candidate is eliminated after the first ballot but rather than return to the electorate for another round of voting the second preferences of the people who voted for the loser are inspected and votes redistributed accordingly. This process is repeated until one candidate has more than 50% of the votes.

The Tory leadership election is not identical to AV because the electorate can switch votes between rounds, whilst in an AV election the rankings are chosen and frozen at the time of the first (and only) ballot. With electorates of tens of thousands the Tory leadership system could not be used for parliamentary constituencies without substantially increased cost and time taken to conduct the election, I will assert that it would produce the same result as AV.

These political sophisticates have rejected FPTP as a method of choosing who represents them, why do so many of them not support the same for us?

AV will not bring great changes to our elections, the majority of constituencies would return the same MP under AV as they currently do under FPTP. The benefit of AV over FPTP is that tactical voting, where you attempt to encode your preferences with a single X by second guessing who everyone else will vote for, becomes largely irrelevant.

We are not being given a choice between FPTP and an ideal electoral system, we are not being asked whether AV is a perfect system for voting, we are being given a choice between FPTP and Alternative Vote. Personally I would prefer a system of proportional representation, but that isn’t on offer.

In the absence of a better choice I will vote “Yes to AV”!

*The BBC have apparently banned themselves from describing the choice of AV over FPTP as “reform”

An Ethical Foreign Policy

Saddam Hussein helped me to understand the role of the UN and the nation state when he gassed the inhabitants of the Iraqi town of Helabja in 1988. I was 18, and it was the first time I ever saw a dead body on TV. The attack killed something like 5,000 people and injured many more. The reaction of my own country, the UK, it’s allies and the UN was muted and in some quarters seemed to involve trying to blame the Iranians, with whom Iraq was at war.

Then the realisation struck: the UN pretty much leaves you to your own devices within your own borders because to do otherwise would seriously worry its member states. Fancy mandating the interference of a league of nations into your country’s affairs? Because once the principle is established then quite a large fraction of the members of the UN could find calls for interference within their borders. And if you think that sort of response is just for nasty countries like Russia and China, then observe the British response to European Court of Human Rights judgements against it.

Another formative event for me was the end of the first Gulf War: after Iraqi forces had been ejected from the recently invaded Kuwait. The Allied forces were heading towards Baghdad, the Iraqi people were rising up against their leader. And then we stopped and I remember John Major giving a press conference saying, when asked about supporting the Iraqis against their leader, “I don’t remember asking them to revolt” or words to that effect. Surely this, more than any other, was a time to act ethically, to depose the tyrant rather than pop him back in his box with the people of Iraq, a bulwark against our greater Satan: Iran. Invade another country: very bad, but do what you want inside your own borders.

A motivating factor for this post is the wave of revolutions across North Africa and the Middle East in Tunisia, Algeria, Egypt, Yemen, Bahrain, and Libya triggered, it seems by poor economic circumstances, and perhaps the success of other democratic revolutions. Largely these are countries with whom we’ve been happy to do business, Tunisia and Egypt are even popular tourist destinations.

Libya has been ruled by Gaddafi for the last 42 years, he has always seemed to be genuinely quite bonkers and was a great enemy of the UK for a number of years (supporting the IRA, and responsible for the shooting of Yvonne Fletcher outside the Libyan embassy). More recently he has been back in favour but now he’s back out of favour again. Who can keep up with all these changes? His return to favour in 2004 was stimulated by his renunciation of “weapons of mass destruction” and support for the “War on Terror”. It’s interesting that in his recent speech he tried to hit that button again to regain support from his old allies in the West.

Egypt has long been a friend of the West, largely because it has taken the lead amongst Arab nations in maintaining diplomatic relationship with Israel. For this we conveniently ignore its not particularly good democratic and human rights record. Now the people have managed to oust Hosni Mubarak it turns out that as a nation we weren’t all that keen – who knew? It must be more than a little galling to the opposition in Egypt that we’re willing to show how much we support them just when that support is no longer needed.

Mixed in with all this is David Cameron is off to the Middle East for an arms fair; we’re often told that the weapons, tear gas, rubber bullets that we sell to nations will definitely not be used to suppress their own populations. Quite why we should think this is even remotely plausible I don’t understand. Did the nice dictator promise not to use them against his own population? What else is he going to do with them?

It would be nice to think we could run a foreign policy whereby we didn’t support people who weren’t very nice and in fact actively sought their removal from office perhaps by more widespread use of travel restrictions and financial embargoes on the leadership, as we seem to be heading with Libya now.

Working out which countries are nice and which are nasty shouldn’t be too hard: we could use the Democracy Index, perhaps the Press Freedom Index, or even the use of the death penalty as a proxy. Indices such as this are always going to be a bit subjective but the same cast appear at the bottom again and again.

I can’t help thinking that across the world people of many nations remember; they remember who we supported and who we didn’t. We in Britain remember, just look at our media regarding Germany, and that was over 60 years ago. Just think what the people of other countries will remember in the years to come.

Deficit reduction through growth

This blog post seeks to answer the question: what economic growth rate does the UK need to sustain in order to reduce the deficit to zero?

This seems like a relevant question at the moment, and I’ve not seen a straightforward calculation of the answer – so I thought I’d give it a go myself. The idea being that even if the end result is not particularly informative the thinking behind getting the end result is useful.

The key parameter of interest here is the gross domestic product (GDP): the amount of goods and services produced in a year in the UK; it’s a measure of how wealthy we are as a nation, how it increases with time is a measure of economic growth. Also important are the deficit (how much the government’s annual spending exceeds its income) and debt (how much the government is borrowing).

Inflation means that the GDP can appear to grow each year with no increase in real economic activity, therefore I decided to use “inflation adjusted” GDP figures. I also preferred to use annual GDP figures rather than quarterly ones.

To model this I took a starting point of a known GDP, debt, deficit and government spend which I then propagated forwards in time: I made the GDP grow by a fixed percentage each year, and assumed that government spending would be flat (I’m using GDP adjusted for inflation so I think this is reasonable). Assuming that the total tax take is a fixed proportion of GDP I can calculate the deficit and hence increasing debt in each year, I add the debt servicing cost to the government spending in each. Since I’m doing everything else in the absence of inflation I’ve used a debt servicing rate of 2% rather than the 5% implied by a £43bn debt interest cost in 2010 – this makes my numbers a bit inconsistent.

I’ve put the calculation in a spreadsheet here.

Given this model my estimate is that the UK would need to sustain GDP growth of 4.8% per year until 2020 in order to reduce the deficit to 0%. This 4.8% GDP growth brings in approximately an additional £30bn in taxes for each year for which the growth is 4.8%. During this time the debt would rise to nearly 80% of GDP and so the cost of servicing the debt will double. These numbers seem plausible and fit with other numbers I’ve heard knocking around.

To get a feel for how GDP has varied in the past, this is the data for inflation adjusted annual GDP growth in the UK since 1950:

GDPGrowth

The red line shows the “target” 4.8% GDP growth, and the blue bars the actual growth in the economic, adjusted for inflation. The data comes from here. What’s notable is that GDP growth has rarely hit our target and what’s worse, over the last 40 years there have been four recessions (where GDP growth is negative), so the likelihood must be that another recession before or around 2020 is to be expected.

In real-life we are actually using a combination of GDP, government spending cuts and tax increases to bring down the deficit. These calculations indicate 0.5% GDP growth is approximately £7bn per year which is equivalent to a couple of pence on basic rate (see here) or about 1% of government spending (see here).

Doing this calculation is revealing because it highlights why there is an emphasis on cuts in government spending as a means of reducing the deficit. This had been a bit of a mystery to me with the figure of 80:20 cuts to taxes ratio being widely quoted as some sort of optimum, although there is some indication of other countries working with a ratio closer to 50:50. The thing is that when you cut your spending, you are in control. You can set a target for reduction and have a fair degree of confidence you can hit that target and show you have hit that target relatively quickly and easily. On the contrary relying on growth in GDP, or taxes, is a rather more unpredictable exercise: taxes because the amount of tax raised depends on the GDP.

The Office for Budget Responsibility (OBR) published uncertainty bounds for it’s future predictions of GDP in their pre-budget report last year (see p10 and Annex A in this report), their central forecast is for growth of 2.5% but by 2014 (i.e. in only 4 years) they estimated only a 30% chance that it lay between 1.5% and 3.5% actually they only claim a 40% chance of being in that range for this year (2011).

At the risk of being nearly topical, GDP is reported to have shrunk by 0.5% in the last quarter of last year, 2010. This is largely irrelevant to this post, although forecasts for GDP were growth of ~0.5% which supports the idea that GDP is not readily predictable. It’s worth noting that the ONS will revise this figure at monthly intervals until they get all the data in – the current estimate is based on 40% of the data being available.

Given this abysmal ability to predict GDP I suspect that there is little governments can do to influence the growth in GDP. It would be interesting to estimate the influence government policy has relative to prevailing global economic conditions, and what timelags there might be between policy changes and growth.

I think these calculations are illustrative rather than definitive, and what I’d really like is for someone to point to some better calculations!