Category: Technology

Programming, gadgets (reviews thereof) and computers

pdftables – a Python library for getting tables out of PDF files

This post was first published at ScraperWiki.

One of the top searches bringing people to the ScraperWiki blog is “how do I scrape PDFs?” The answer typically being “with difficulty”, but things are getting better all the time.

PDF is a page description format, it has no knowledge of the logical structure of a document such as where titles are, or paragraphs, or whether it’s two column format or one column. It just knows where characters are on the page. The plot below shows how characters are laid out for a large table in a PDF file.

AlmondBoard7_LTChar

This makes extracting structured data from PDF a little challenging.

Don’t get me wrong, PDF is a useful format in the right place, if someone sends me a CV – I expect to get it in PDF because it’s a read only format. Send it in Microsoft Word format and the implication is that I can edit it – which makes no sense.

I’ve been parsing PDF files for a few years now, to start with using simple online PDF to text converters, then with pdftohtml which gave me better location data for text and now using the Python pdfminer library which extracts non-text elements and as well as bonding words into sentences and coherent blocks. This classification is shown in the plot below, the blue boxes show where pdfminer has joined characters together to make text boxes (which may be words or sentences). The red boxes show lines and rectangles (i.e. non-text elements).

AlmondBoard7

More widely at ScraperWiki we’ve been processing PDF since our inception with the tools I’ve described above and also the commercial, Abbyy software.

As well as processing text documents such as parliamentary proceedings, we’re also interested in tables of numbers. This is where the pdftables library comes in, we’re working towards making scrapers which are indifferent to the format in which a table is stored, receiving them via the OKFN messytables library which takes adapters to different file types. We’ve already added support to messytables for HTML, now its time for PDF support using our new, version-much-less-than-one pdftables library.

Amongst the alternatives to our own efforts are Mozilla’s Tabula, written in Ruby and requiring the user to draw around the target table, and Abbyy’s software which is commercial rather than open source.

pdftables can take a file handle and tell you which pages have tables on them, it can extract the contents of a specified page as a single table and by extension it can return all of the tables of a document (at the rate of one per page). It’s possible, for simple tables to do this with no parameters but for more difficult layouts it currently takes hints in the form of words found on the top and bottom rows of the table you are looking for. The tables are returned as a list of list of lists of strings, along with a diagnostic object which you can use to make plots. If you’re using the messytables library you just get back a tableset object.

It turns out the defining characteristic of a data scientist is that I plot things at the drop of a hat, I want to see the data I’m handling. And so it is with the development of the pdftables algorithms. The method used is inspired by image analysis algorithms, similar to the Hough transforms used in Tabula. A Hough transform will find arbitrarily oriented lines in an image but our problem is a little simpler – we’re interested in vertical and horizontal rows.

To find these vertical rows and columns we project the bounding boxes of the text on a page onto the horizontal axis ( to find the columns) and the vertical axis to find the rows. By projection we mean counting up the number of text elements along a given horizontal or vertical line. The row and column boundaries are marked by low values, gullies, in the plot of the projection. The rows and columns of the table form high mountains, you can see this clearly in the plot below. Here we are looking at the PDF page at the level of individual characters, the plots at the top and left show the projections. The black dots show where pdftables has placed the row and column boundaries.

AlmondBoard8_projection

pdftables is currently useful for supervised use but not so good if you want to just throw PDF files at it. You can find pdftables on Github and you can see the functionality we are still working on in the issue tracker. Top priorities are finding more than one table on a page and identifying multi-column text layouts to help with this process.

You’re invited to have a play and tell us what you think – [email protected]

Testing, testing…

testingtesting

This post was first published at ScraperWiki.

Data science is a distinct profession from software engineering. Data scientists may write a lot of computer code but the aim of their code is to answer questions about data. Sometimes they might want to expose the analysis software they have written to others in order they can answer questions for themselves, and this is where the pain starts. This is because writing code that only you will use and writing code someone else will use can be quite different.

ScraperWiki is a mixed environment, it contains people with a background in software engineering and those with a background in data analysis, like myself. Left to my own devices I will write code that simply does the analysis required. What it lacks is engineering. This might show up in its responses to the unexpected, its interactions with the user, its logical structure, or its reliability.

These shortcomings are addressed by good software engineering, an area of which I have theoretical knowledge but only sporadic implementation!

I was introduced to practical testing through pair programming: there were already tests in place for the code we were working on and we just ran them after each moderate chunk of code change. It was really easy. I was so excited by it that in the next session of pair programming, with someone else, it was me that suggested we added some tests!

My programming at ScraperWiki is typically in Python, for which there a number of useful testing tools. I typically work from Windows, using the Spyder IDE and I have a bash terminal window open to commit code to either BitBucket or Github. This second terminal turns out to be very handy for running tests.

Python has an internal testing mechanism called doctest which allows you to write tests into the top of a function in what looks like a comment. Typically these comprise a call to the function from a command prompt followed by the expected response. These tests are executed by running a command like:

 python -m doctest yourfile.py


def threshold_above(hist, threshold_value):
"""
>>> threshold_above(collections.Counter({518: 10, 520: 20, 530: 20, 525: 17}), 15)
[520, 530, 525]
"""
if not isinstance(hist,collections.Counter):
raise ValueError("requires collections.Counter")
above = [k for k, v in hist.items() if v > threshold_value]
return above

view raw

doctests.py

hosted with ❤ by GitHub

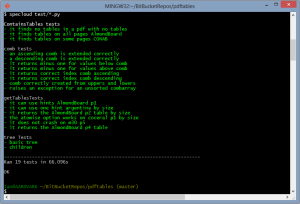
This is OK, and it’s “batteries included” but I find the mechanism a bit ugly. When you’re doing anything more complicated than testing inputs and outputs for individual functions, you want to use a more flexible mechanism like nose tools, with specloud to beautify the test output. The Git-Bash terminal on Windows needs a little shim in the form of ansicon to take full advantage of specloud’s features. Once you’re suitably tooled up, passed tests are marked with a vibrant, satisfying green and the failed tests by a dismal, uncomfortable red.

My latest project, a module which automatically extracts tables from PDF files, has testing. It divides into two categories: testing the overall functionality – handy as I fiddle with structure – and tests for mathematically or logically complex functions. In this second area I’ve started writing the tests before the functions, this is because often this type of function has a simple enough description and test case but implementation is a bit tricky. You can see the tests I have written for one of these functions here.

Testing isn’t as disruptive to my workflow as I thought it would be. Typically I would be repeatedly running my code as I explored my analysis making changes to a core pilot script. Using testing I can use multiple pilot scripts each testing different parts of my code; I’m testing more of my code more often and I can undertake moderate changes to my code, safe in the knowledge that my tests will limit the chances of unintended consequences.

Three years of electronic books

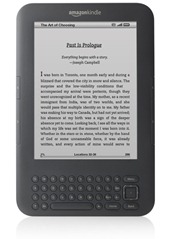
AmazonKindleIt is customary to write reviews of things when they are fresh and new. This blog post is a little different in the sense that it is a review of 3 years of electronic book usage.

My entry to e-books was with the Kindle: a beautiful, crisp display, fantastic battery life but with a user interface which lagged behind smartphones of the time. More recently I have bought a Nexus 7 tablet on which I use the Kindle app, and very occasionally use my phone to read.

Primarily my reading on the Kindle has been fiction with a little modern politics, and the odd book on technology. I have tried non-fiction a couple of times but have been disappointed (the illustrations come out poorly). Fiction works well because there are just words, you start reading at the beginning of the book and carry on to the end in a linear fashion. The only real issue I’ve had is that sometimes, with multiple devices and careless clicking it’s possible to lose your place; I found this more of a problem than with a physical book. My physical books I bookmark with railtickets, very occasionally they fall out but then I have a rough memory of where they were in the book via the depth axis, and flicking rapidly through a book is easy (i.e. pages per second) – the glimpse of chapter start, the layout of paragraphs is enough to let you know where you are.

There are other times when the lack of a physical presence is galling: my house is full of books, many have migrated to the loft on the arrival of Thomas, my now-toddling son. But many still remain, visible to visitors. Slightly shamefaced I admit to a certain pretention in my retention policy: Ulysses found shelf space for many years whilst science fiction and fantasy made a rapid exit. Nonfiction is generally kept. Books tell you of a persons interests, and form an ad hoc lending library. In the same way as there beaver’s dam is part of its extended phenotype, my books are part of mine. With ebooks we largely lose this display function, I can publish my reading on services like Shelfari but this is not the same a books on shelves. The same applies for train reading, with a physical book readers can see what each other is reading.

Another missing aspect of physicality, I’ve read Reamde by Neal Stephenson a book of a thousand pages, and JavaScript: the Good Parts by Douglas Crockford, only a hundred and fifty or so. The Kindle was the same size for both books! Really it needs some sort of inflatable bladder which inflates to match the number of pages in the book, perhaps deflating as you made your way through the book.

Regular readers of this blog will know I blog what I read, at least for non-fiction. My scheme for this is to read, taking notes in Evernote. This doesn’t work so well on  either the Kindle or Kindle app, too much switching between apps. But the Kindle has a notes and highlighting! I hear you say. Yes, it does but it would appear digital rights management (DRM) has reduced its functionality – I can’t share my notes easily and, if your book is stored as a personal document because it didn’t come from the Kindle store then you can’t even share notes across devices. This is a DRM issue because I suspect functionality is limited because without limits you could simply highlight a whole book, or perhaps copy and paste it. And obviously I can’t lend my ebook in the same way as I lend my physical books, or even donate them to charity when I’m finished with them.

This isn’t to say ebooks aren’t really useful – I can take plenty of books on holiday to read without filling my luggage, and I can get them at the last minute. I have a morbid fear of Running Out of Things To Read, which is assuaged by my ebook. In my experience, technology books at the cheaper / lower volume end of the market are also better electronically (and actually the ones I’ve read are relatively unencumbered by DRM), i.e. they come in colour whilst their physical counterparts do not.

Overall verdict: you can pack a lot of fiction onto an ebook but I’ve been using physical books for 40 years and humans have been using them for thousands of years and it shows!

Enterprise data analysis and visualization

This post was first published at ScraperWiki.

The topic for today is a paper[1] by members of the Stanford Visualization Group on interviews with data analysts, entitled “Enterprise Data Analysis and Visualization: An Interview Study”. This is clearly relevant to us here at ScraperWiki, and thankfully their analysis fits in with the things we are trying to achieve.

The study is compiled from interviews with 35 data analysts across a range of business sectors including finance, health care, social networking, marketing and retail. The respondents are harvested via personal contacts and predominantly from Northern California; as such it is not a random sample, we should consider results to be qualitatively indicative rather than quantitatively accurate.

The study identifies three classes of analyst whom they refer to as Hackers, Scripters and Application Users. The Hacker role was defined as those chaining together different analysis tools to reach a final data analysis. Scripters, on the other hand, conducted most of their analysis in one package such as R or Matlab and were less likely to scrape raw data sources. Scripters tended to carry out more sophisticated analysis than Hackers, with analysis and visualisation all in the single software package. Finally, Application Users worked largely in Excel with data supplied to them by IT departments. I suspect a wider survey would show a predominance of Application Users and a relatively smaller relative population of Hackers.

The authors divide the process of data analysis into 5 broad phases Discovery – Wrangle – Profile – Model – Report. These phases are generally self explanatory – wrangling is the process of parsing data into a format suitable for further analysis and profiling is the process of checking the data quality and establishing fully the nature of the data.

This is all summarised in the figure below, each column represents an individual so we can see in this sample that Hackers predominate.

table

At the bottom of the table are identified the tools used, divided into database, scripting and modeling types. Looking across the tools in use SQL is key in databases, Java and Python in scripting, R and Excel in modeling. It’s interesting to note here that even the Hackers make quite heavy use of Excel.

The paper goes on to discuss the organizational and collaborative structures in which data analysts work, frequently an IT department is responsible for internal data sources and the productionising of analysis workflows.

Its interesting to highlight the pain points identified by interviewees and interviewers:

  • scripts and intermediate data not shared;
  • discovery and wrangling are time consuming and tedious processes;
  • workflows not reusable;
  • ingesting semi-structured data such as log files is challenging.

Why does this happen? Typically the wrangling scraping phase of the operation is ad hoc, the scripts used are short, practioners don’t see this as their core expertise and they’ll typically draw from a limited number of data sources meaning there is little scope to build generic tools. Revision control tends not to be used, even for the scripting tools where it is relatively straightforward perhaps because practioners have not been introduced to revision control or simply see the code they write as too insignificant to bother with revision control.

ScraperWiki has its roots in data journalism, open source software and community action but the tools we build are broadly applicable, as one of the respondents to the survey said:

“An analyst at a large hedge fund noted their organization’s ability to make use of publicly available but poorly-structured data was their primary advantage over competitors.”

References

[1] S. Kandel, A. Paepcke, J. M. Hellerstein, and J. Heer, “Enterprise Data Analysis and Visualization : An Interview Study,” IEEE Trans. Vis. Comput. Graph., vol. 18(12), (2012), pp. 2917–2926.

More Shiny – Sony Vaio T13 laptop with Windows 8

SonyVaioT13

I thought I’d mix together a review of my shiny new laptop (a Sony Vaio T13) with one of Windows 8 which came pre-installed on the laptop.

The laptop

Six years after buying my last laptop I have replaced it with another Sony Vaio. At the time I bought the first one I didn’t think I would do this, my old Sony Vaio (VGN-SZ2M) is a nice machine but it was infested with Sony cruftware which added little functionality and what it did try to add didn’t seem to work and  the couriers Sony selected left it with a neighbour without asking whether this was appropriate. It had a weird black plastic finish which was probably described as "carbon fibre". It’s worked fine although I found the 80GB hard disk a little cramped and as the years went by it felt slower and slower when compared to the other machines I use.

After poking around extensively I finally decided on another Sony Vaio, other contenders were the Lenovo Yoga 13 (limited availability and would that hinge really hold out?), the Acer Aspire S7 (more pricey for a poorer config and apparently no option for a big conventional drive) and offerings from Samsung, Toshiba and Dell – the bar for being a contender in this limited set was the touchscreen. I did look at non-touchscreen variants too and particularly liked the look of the Lenovo IdeaPad U410.

Having decided, I bought direct from Sony getting to get a bit more configuration flexibility adding 8GB RAM, an i7 processor and going for the 32GB SSD/500GB conventional hard drive combination, this is an ultrabook class laptop with a 13.3" touchscreen, no optical drive, and Windows 8. I liked the idea of getting a pure SSD system but the price Sony charges for the upgrade is about double the price of the highly regarded Samsung 840 Pro series SSDs so maybe I’ll be opening the thing up soon. It weighs 1.5kg which is light but not the lightest in this class, I decided on a touchscreen since it didn’t seem to add hugely to the cost and it isn’t something you can retrofit should the desire arise.

It is a very beautiful thing: brushed metal with chromed highlights, and in its pristine state it comes out of hibernate very quickly.

Compared to my old laptop it has the same footprint, unsurprising since the screen is the same size. The keyboard is narrower though, losing a column of keys, but the device is about half the thickness  – having lost the optical drive.

I worried a little about the monolithic touchpad with no separate left and right mouse buttons but it has a positive click in these two locations so I’ve not noticed the lack of separate buttons.

The screen resolution may be a little deficient (1366×768) but it is comparable with most of the laptops in its class and I intend using it on an external monitor anyway.

There is a small infestation of cruftware, featuring an update centre which seems to struggle to provide the necessary bandwith and an update-able electronic manual which I can’t seem to get hold of because the instructions for downloading it take you around in a loop.

As if in pique my old desktop PC failed shortly after I got the new Vaio so I’m using it as my sole computer for now, this works fine except it is a pain to install CD based software for various bits of hardware (quite why my video camera shipped with 4 CDs of software I don’t understand).

So overall – the Sony Vaio gets an A, a tick or some number of stars between 5 and 10.

Windows 8

image

I have a bit of a habit for getting computers with brand new Microsoft operating systems, although fortunately I skipped Windows Vista. Windows 8 takes a bit of getting used to, the best way of thinking about it is as Windows 7 with a mobile phone interface dropped on top of it. This is both good and bad. Personally I rather like Windows 7, and I’m also rather pleased with the Android-based touchscreen interface on my HTC Desire phone but the combination of the two is a bit disturbing.

Actually "a bit disturbing" is wrong "crap" would be better, the new style apps follow very different UI rules from conventional Windows apps and major in form over content – for example the pre-installed twitter app, although pretty and swooshy with the touchscreen is utterly useless as a twitter client. Not only does it have limited functionality but in order to view anything but the briefest of timelines you need to flap your arm about like a deranged semaphorist. The twitter app from twitter is marginally more functional but looks like the portrait aspect ratio phone screen placed in the middle of a wide laptop screen. Comparing my Android phone and tablet it strikes me few people have cracked scaling apps from phone to tablet size screens, let alone all the way to laptop screen sizes.

Live tiles offer interesting possibilities but they are constrained to one of two sizes, and I’ve yet to find one which does anything particularly interesting.

Microsoft is very keen for developers to write the mobile phone style apps, at one point the (free) Express version of Visual Studio was only going to allow developers to target the mobile phone style apps.

The only real redeeming feature of the new Windows 8 additions is that, once you’ve accepted the concept, the Start screen is better than the old Start button.

Not so long ago I would have "struck down upon thee with great vengeance and furious anger those who" touched the screen of any device I owned, these days I’m a little bit more relaxed: I find the touchscreen a nice adjunct to more conventional input but I have a smeary screen now.

It seems to me there are a limited number of things you need to "get" about an operating system in order to use it with a peaceful mind, for Windows 7 a big one was that you didn’t need to go stumbling through a cascade of entries in the Start menu – you just start typing the name of your desired application into the search box and it was revealed fairly promptly. Start typing when you are on the Windows 8 Start screen and you launch just such a search – how the hell you’re supposed to know this is a mystery to me. And this seems like one of the core problems with Windows 8 – there are some nice little interface features but there’s no way you would guess they were there or find them by accident.

Windows 8 is keen for you to login using a Microsoft account, it is possible to just use a local account but I thought “in for a penny, in for a pound” and went ahead and set one up. Interestingly you can see the benefit of this approach when using Google Chrome, when I installed Chrome it automatically installed the plugins I have on other PCs, my autocorrect settings and so forth – instantly I was at home. I guess this is the longer term plan for Windows 8. It also wants me to have an xbox account to buy music and video.

Some hints for new users of Windows 8:

  • To shift tiles around on the Start page, hold them and drag then up or down initially (not left-right), to zoom out drag them towards the bottom of the screen;
  • If you use Google Chrome as your default browser the title bar icons (minimise, maximise and close) disappear, to fix this don’t use it as your default browser;
  • There exist both new style and old style applications, some things are available in both formats, for example Dropbox. The new-style apps resemble phone apps but offer limited functionality;
  • New-style apps don’t have an "exit" button, simply navigate away from them as you would a phone app;
  • The Start screen replaces the Start menu on the old Windows 7 desktop, to search for anything just start typing!
  • Windows 8 style apps cannot play MPEG2 files, this is only available for Windows 8 Pro with added Windows Media Centre. Windows Media Player will play them (suitable codecs installed – I used Shark007) and VLC player works fine.

On the last item: this seems a bit bonkers – the video app on the mobile-style interface can see your video library perhaps containing an unrelenting series of videos of your growing child which will almost inevitably be in MPEG2 format as a default so crippling this functionality seems a bit stupid.

Bottom line: Windows 8 is very pretty and the Start screen is, in my view, better than the old Windows 7 Start menu once you’ve got your head around it. The idea of putting a mobile phone interface, with mobile phone style apps, on top of a desktop interface is stupid – my opinion on this may change if I see some apps that are optimised for laptops. Mobile interfaces such as iOS and Android are optimised for consumption which is fine, but many people will still be getting PC class devices to do “work” and for the main the new mobile interface in Windows 8 gets in the way of that.

And now to install Ubuntu on it… a process so exciting I have made it the subject of a second blog post.