Tag: maps

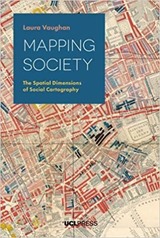
Book review: Mapping Society by Laura Vaughan

mapping_societyMy next review is of Mapping Society: The Spatial Dimensions of Social Cartography by Laura Vaughan. This book covers four broad themes around mapping which are presented in the order in which they first occurred. As well as discussing contemporary material there is some re-analysis in terms of “space syntax”. This is a modern theory of urban spaces which measures things like accessibility and connectedness for road layouts. This feels very familiar to me since I use a similar approach to estimate the age of buildings on the basis of street layout.  

The first theme is the disease map: maps of deaths due to disease, typically during epidemic outbreaks. Snow’s map of cholera deaths around the Broad Street pump in 1853 is the best known of these. His innovation was to use the map to identify the cause of cholera as being waterborne, and to use the map as a device for presenting his case. At the time the prevailing theory of disease was that it was airborne – the miasma theory. Snow’s map was not the first of its type though. Vaughan, wisely, doesn’t get into the discussion of the “first” such map but presents Seaman’s map of yellow fever deaths in New York, dating from 1797 as an early example. She cites a study finding 53 published maps of cholera deaths by 1832.

These maps of disease were used as to motivate the introduction of sanitation laws which became widespread during the middle years of the 19th century.

The second theme is poverty. Maps of disease often included data on sanitation and also poverty. Charles Booth’s work on London towards the end of the 19th century is the most notable in this area, his initial study was repeated 10 years later and then a further 30 years on in a separate survey. The novelty here was to measure levels of poverty in some sort of quantitative way, for this he is sometimes called the first social scientist. The fears of society at the time were that ” the poor” formed a cohesive mass that could rise up. Booth showed this was not the case, the poor were poor in many different ways and for different reasons. Poverty was often found in close proximity to wealth. Work like Booth’s was used to motivate changes in building regulation. Booth observed that irregularity of income was important as well as absolute level. One of the observations from this period is that areas of poverty, often identified at the scale of households, where correlated with inaccessibility – being off the beaten track. The poor were not found on the main streets but rather tucked away in poor housing set back behind better accommodation. New infrastructure such as canals and railways could introduce new pockets of inaccessibility – leading to poverty, or at least attracting the poor to areas thus cut off.

Booth’s work helped to motivate slum clearances and ultimately social security policies such as state pensions. Slum clearances proved to be a mixed benefit, all to often the slum is replaced with more desirable accommodation which displaces the original occupants to be replaced by the slightly more wealthy. The problems that the urban environment engenders can be very persistent. The spatial distribution of deaths in Paris due to cholera in 1849 are quite similar to those from the heatwave of 2003.

The third theme was nationality, race and immigration. These arose around the end of the 19th century, in both San Francisco’s Chinatown area, where the outcome was pretty malign in that Chinese immigration was banned and also in the East End of London, where there was a large influx of Jewish immigrants who came as a result of the Russian progroms. The book cites the Venice Jewish Ghetto, founded in the 16th century and where we get the word “ghetto” from. In the US there were maps of race, W.E.B. du Bois, himself an African-American pioneered this work in Philadelphia.  

The final theme is crime, in fact much of this chapter is about licensed premises. In the latter half of the 19th century the drinking habits of the working classes were of intense concern. In the US this concern eventually led to Prohibition but both the UK and US had temperance movements. In the more distant past, public houses and bars served as the “front room” for poorer families. Their own homes were quite probably overcrowded, unheated and insanitary – the local pub was a warm pleasant place to spend any free time. They were also a place to find work, both legal and illegal.

Vaughan highlights that we don’t see maps of the form found in the 19th century in the late 20th century. Typically maps from this later period are on a larger scale, we don’t see data presented at such high spatial resolution but they cover a wider area. For example, the national census in the UK typically presents data at the Lower Super Output Area scale which covers approximately 1000 dwellings. Sometimes data is available at postcode level, such as the Police.UK crime data, a postcode will typically contain approximately 30 addresses. Devices such as mobile phones mean that high resolution data collection at scale is feasible with more modest resources than previously required. However, we would not publish the data in the manner of the 19th century maps because it is personal information, essentially maps such as Booth’s and Snow’s identify individuals including there health and wealth status.

Mapping Society is a beautifully produced book, with colour figures throughout rather than relegated to central pages, it gives some background to those iconic maps with which many of us are familiar. 

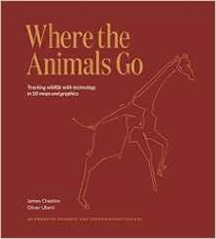
Book review: Where the Animals Go by James Cheshire and Oliver Uberti

animalsgoIt is becoming a tradition for me to receive a beautiful James Cheshire and Oliver Uberti coffee table book for my birthday. A couple of years ago it was The Information Capital, this year it was Where the Animals Go.

Where the Animals Go is a collection of stories and visualisations all relating to the tracking of animals, each story occupies at most a few pages and is accompanied by a couple of maps which trace the paths of one or more of the species in question across the earth. The maps are beautiful.

The book starts with an introduction which covers the evolution of animal tracking technology. The bulk tracking of the movement of animals on an hourly or faster basis has become easier with the advent of commodity GPS devices since the 1990s. Some of these raw data are now being published on aggregation websites such as Movebank.

Precursors to these GPS tracking systems are old-fashioned bird-ringing – a passive technique which relies on recapture of animals and has been around since the early 19th century. The Argos system relies on data from tags being transmitted to a small constellation of satellites – it has lower temporary and spatial resolution than GPS. There are also radio and acoustic tracking methods which have been around from the sixties.

In the text we discover how ants have been tracked in an artificial nest using tiny bar codes, and Daphnia zooplankton have been tracked with fluorescent nanoparticles in a tiny aquarium. Penguin colonies have been identified, and numbers estimated, from satellite imagery of the guano (posh word for poo) that they stand amidst.

I must admit to being a bit of an enthusiast for tracking myself, particularly when out skiing or walking. I used use GPS to geotag my photographs – parenthood has put a stop to such pursuits. I started using GPS about 10 years ago when the process was a bit clunky both in terms of the hardware and the software to process tracks. Nowadays I can record a GPS track on my watch or a mobile phone. So I can easily see how advances in technology relate to advances in the study of animal movement with GPS sensors becoming feasible for ever smaller animals.

After introducing the technology there are then three parts covering animals on the land, in the water and in the air.

The tracks of troops of baboons seemed most similar to the tracks of my Alpine skiing holidays. In this study a number of baboons from the same troop were tracked, this made it possible to see something of the leadership, or otherwise, behaviour of the baboons but this is actually unusual – in most cases a small number of individuals from a group are tracked.

Most entertaining are the tracks of animals who have been relocated for human convenience, and promptly return to the place from whence they came – pythons and crocodiles are in this group. Sadly, I suspect this type of behaviour does not end well for the animals concerned.

Related to this are those animals who live in close proximity to humans and find their why blocked by major highways, mountain lions in California – for example. Animal tracking can show the degree to which major highways cause a problem, and also show the way to solutions in providing corridors.

Sometimes tracking clears animals of what humans consider to be mis-deeds – the tracking, by acoustic sensors, of sharks in Hawaii falls into this category. More benignly it has been discovered that oilbirds in Venezuela did not simply foray out of their nesting caves at night and return at dawn, thus failing to carry out vital ecosystem services such as dispersing seeds. Instead GPS tracking showed that they spent days out in the forest foraging, and roosting in trees.

Generally the animals portrayed are depicted moving in a plane (mathematically speaking) across the land but sometimes they break out into the third dimension – an example is vultures spiralling upwards on thermals. Hang-gliding friends I know would be interested in this. Also included are the bar-headed geese, who migrate across the Himalayas, it turns out they generally stick to the lowest altitudes they can get away with, however they still exhibit great endurance in high altitude flying.

The accompanying text provides detail on what we see in the maps, and also some human interest in the scientists who collected the data.

Another beautiful book, and the references are sufficient for you to go and find out more about any of the individual stories. There is a dedicated website where you can see excerpts of Where the Animals Go.  

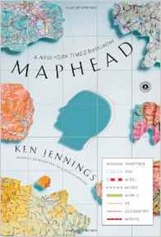
Book review: Maphead by Ken Jennings

mapheadMaphead by Ken Jennings is a trip around various groups of people obsessed with maps and things geographic: collectors, makers of fantasy maps, geocachers, paper rally-ers,confluence hunters and so forth. It all makes me feel right at home!

The book starts with Jennings’ own obsession with maps. He pins his obsession to a move, at an early age, to South Korea with his family. His obsession is a plain, common or garden one with much poring over atlases and maps. He also likes toponymics, the naming of places. There are the somewhat obscene, such as Dildo, Newfoundland – my personal favourite of these is “Bresty Haw” (54.326750, –3.008447). There are also the commercial, such as Truth or Consequences in New Mexico. On a more serious note the US renamed a whole pile of places,to mildly less offensive variants such as “Dead Negro Draw”.

An early chapter discusses David Helgren’s 1983 quiz of his University of Miami students which found them to be pretty abysmal at finding even large places, such as Chicago on the map. There is much wailing and gnashing of teeth at this, bemoaning the state of education and in particular the lack of a firm grounding in geography. I was growing up in the early eighties and by that time the rote learning of places was somewhat passé, a private vice that some odd children engaged in. Geography became more the study of systems and ideas. Do we need to learn the capital of Mongolia by rote these days? Probably not, but there is a certain pleasure in knowing all of the US states or the capital cities of all the countries of the world.

The US has a National Geographic Bee where students from across the country compete to be the Queen Bee (or winner). The level of the competition seems pretty high to me. I was bemused to find the scoring scheme for the author’s own quiz at the very end of the book featuring grades of “Terrain Wreck” and “The Atlas Shrugs”.

Collectors of maps have their own chapter, I have ambivalent feelings about this. In some ways it’s just conspicuous consumption but, perhaps with all collecting of this type, is often linked with genuine expertise. Occasionally I have considered buying a complete set Ordnance Survey maps.

The highway obsessives are a group of which I was unaware. It turns out that there are people who photograph the signs on every junction of the US highway system. This has evolved into the Massacre Rally – armchair, map-based rallying! Here the players follower written questions to guide them across the country. Reading the web page I’m just a little bit tempted. The rally is based on the iconic Rand McNally road atlases which I was surprised to learn drove road signage in the US, its surveyors painted their own signage onto telegraph poles in the absence of any official markings.

Geocaching and confluence hunting get chapters of their own related to the travel clubs whose members aim to visit as many countries as possible. Geocaching came in to being when the selective availability on GPS was lifted in 2000, increasing the precision of position finding to domestic users by an order of magnitude, thereby allowing geocachers to share the coordinates of small, hidden caches with the reasonable expectation that they can be found using a GPS handset. Confluence hunters are related in that they visit locations with integer values of latitude and longitude.

The technology of maps has moved on significantly in my life time, GPS has shrunk to the size that it now fits into my watch. I can navigate to any place on earth in Google Maps, and see an overhead view, and for many locations I can also see a view from the street.This leads to interesting new games such as GeoGuessr – guess where you are from a Google Street View.

As an aside we also discover the origin of the idea of the 1:1 scale map, in Lewis Carroll’s novel Syvlie and Bruno which also introduces the idea of paintballing.

The book seems to miss my own personal obsession: filling maps with data. I spent many happy hours finding the triangulation points for Delambre and Mechain’s survey of the meridian through Paris to set the length of the metre. Or my maps of the 2010 General Election results. One of my current great pains is that the LIDAR maps the Environment Agency has released of England and Wales is the gaps in coverage. The absence of Scotland and Northern Ireland from the LIDAR coverage is an abomination in my eyes. 

Maphead is a short read, not particularly challenging and a comforting reminder that there are other people like you (for certain values of you).

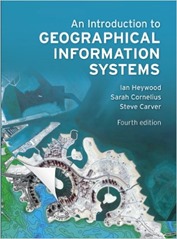
Book review: An Introduction to Geographical Information Systems by Ian Heywood et al

HeywoodI’ve been doing quite a lot of work around Geographical Information Systems recently. So I thought I should get some background understanding to avoid repeating the mistakes of others. I turned to An Introduction to Geographic Information Systems by Ian Heywood, Sarah Cornelius and Steve Carver, now in its fourth edition.

This is an undergraduate text, the number of editions suggests it to be a good one. The first edition of Introduction was published in 1998 and this shows in the content, much of the material is rooted in that time with excursions into more recent matters. There is mention of CRT displays and Personal Data Assistants (PDA). This edition was published in 2011, obviously quite a lot of new material has been added since the first edition but it clearly forms the core of the book.

I quite deliberately chose a book that didn’t mention the latest shiny technologies I am currently working with (QGIS, Open Layers 3, spatial extensions in MariaDB) since that sort of stuff ages fast and the best, i.e. most up to date, information is on the web.

GIS allows you to store spatially related data with the ability to build maps using layers of different content and combine this spatial data with attributes stored in databases.

Early users were governments both local and national and their agencies, who must manage large amounts of land. These were followed by utility companies who had geographically distributed infrastructure to manage. More recently retail companies have become interested in GIS as a way of optimising store location and marketing. The application of GIS is frequently in the area of “decision support”, along the lines of “where should I site my…?” Although, “how should I get around these locations?” is also a frequent question. And with GPS for route finding arguably all of us carry around a GIS, and they are certainly important to logistics companies.

From the later stages of the book we learn how Geographic Information Systems were born in the mid to late 1960s became of increasing academic interest through the 1970s, started to see wider uptake in the eighties and became a commodity in the nineties. With the advent of Google Maps and navigation apps on mobile phones GIS is now ubiquitous.

I find it striking that the Douglas-Peucker algorithm for line simplification, born in the early seventies, is recently implemented in my favoured spatially enabled database (MariaDB/MySQL). These spatial extensions in SQL appear to have grown out of a 1999 standard from the OGC (Open Geospatial Consortium). Looking at who has implemented the standards is a good way of getting an overview of the GIS market.

The book is UK-centric but not overwhelmingly so, we learn about the Ordnance Survey mapping products and the UK postcode system, and the example of finding a site for a nuclear waste repository in the UK is a recurring theme.

Issues in GIS have not really changed a great deal, projection and coordinate transforms are still important, and a source of angst (I have experienced this angst personally!). We still see digitisation and other data quality issues in digitized data, although perhaps the source is no longer the process of manual digitization from paper but of inconsistency in labelling and GPS errors.

One of the challenges not discussed in Introduction is the licensing of geographic data, this has recently been in the news with the British government spending £5 million to rebuild an open address database for the UK, having sold off the current one with the Royal Mail in 2013. (£5 million is likely just the start). UN-OCHA faces similar issues in coordinating aid in disaster areas, the UK is fairly open in making details of administrative boundaries within the UK available electronically but this is not the case globally.

I have made some use of conventional GIS software in the form of QGIS which although powerful, flexible and capable I find slow and ugly. I find it really hand for a quick look-see at data in common geospatial formats. For more in-depth analysis and visualisation I use a combination of spatial extensions in SQL, Python and browser technology.

I found the case studies the most useful part of this book, these are from a wide range of authors and describe real life examples of the ideas discussed in the main text. The main text uses the hypothetical ski resort of Happy Valley as a long running example. As befits a proper undergraduate introduction there are lots of references to further reading.

Despite its sometimes dated feel Introduction to Geographic Information Systems does exactly what it says on the tin.

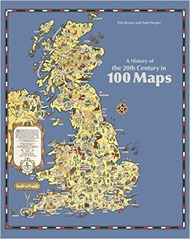
Book review: A History of the 20th Century in 100 Maps by Tim Bryars an Tom Harper

100mapsA History of the 20th Century in 100 Maps by Tim Bryars and Tom Harper is similar in spirit to The Information Capital by James Cheshire and Oliver Uberti: a coffee table book pairing largely geographic visualisations with relatively brief text. Looking back I see that The Information Capital was a birthday present from Mrs SomeBeans, 100 Maps was a Christmas present from the same!

The book is published by the British Library. The maps are wide ranging in scale, scope and origin. Ordnance Survey maps of the trenches around the Battle of the Somme nestle against tourist maps of the Yorkshire coast, and tourist maps of Second World War Paris for the Nazi occupiers. The military maps are based on the detailed work by organisations like the Ordnance Survey whilst other maps are cartoons of varying degrees of refinement, “crude” being particularly relevant in the case of he Viz map of Europe!

War and tourism are recurring themes of the book. In war maps are used to plan a battle, conduct a post mortem and as propaganda. It is not uncommon to see newspaper cartoon style maps with countries represented by animals, or breeds of dog. In tourism maps are used as marketing – the presentation and “incidental” details at least as important as the navigation. Sometimes the “tourism” relates to state events. Not quite fitting into either war or tourism is the crudest map in the book, a sketch of Antarctica on the back of a menu card, made by Shackleton as he tried to persuade his neighbour at a formal dinner to help fund his expedition.

A third category is the economic map showing, for example the distribution of new factories around the UK in the post-war period or the exploitation of oil in the Caribbean or the North Sea. This maps were published sometimes for education, and sometimes as part of a prospectus for investment or a tool of persuasion.   

The focus of the book is really on the history of Britain rather than maps, this is a useful bait-and-switch for people like me who are ardent followers of maps but not so much of history. It struck me the impact that the two world wars of the 20th century had on UK. Not simply the effect of war itself but the rise of women in the workforce, and independence movements in the now former colonies, homes for heroes, nationalisation – the list goes on. It seems the appetite for all these things was generated during the First World War but they were not satisfied until after the Second. The First World War also saw the introduction of prohibitions on opium and cocaine, prior to this they were seen as the safe recreation of the upper middle classes during the war they were seen as a risk to the war effort. America had lead the way with the prohibition of drugs, and later alcohol, seeing them as a vice of immigrants and working classes.

I didn’t realise there were no controls on immigration to the UK until the 1905 Alien Act, this nugget is found in a commentary on a map entitled “Jewish East London”. This map was based on Charles Booth’s social maps of London and published by the Toybnee Trust. The Jewish population had been increasing over the preceding 25 years following pogroms and anti-Semitic violence in the Russian Empire. The Trust published the map alongside articles for and against immigration controls but, as the authors point out, the map is designed with its use of colouring and legends to make the case against.

100 maps is not all about the real world, E.H. Shepard’s map of the Hundred Acre Wood makes it in, as well Tolkien’s map of Middle Earth. In both cases the map provides an overview of the story inside. I rather like the map of Hundred Acre Wood map with “Eeyores Gloomy Place – rather boggy and sad”, and a compass rose which spells out P-O-O-H.

The book is well-made and presented but in these times of zoomable online maps physical media struggle to keep up. The maps are difficult to study in detail at the A4 size in which they are presented. 100 maps makes some comment on the technical evolution of maps, not so much in the collection of data, but in the printing and presentation process. It is only in the final decades of the century that full colour printed maps become commonplace. It is around 1990 that the Ordnance Survey becomes fully digital in its data collection.

All in all a fine present – thank you Mrs SomeBeans!