Tag: Python

Sublime

sublime_text

Sublime Text

Coders can be obsessive about their text editors. Dividing into relatively good natured camps. It is text editors not development environments over which they obsess and the great schism is between is between the followers of vim and those of Emacs. The line between text editor and development environment can be a bit fuzzy. A development environment is designed to help you do all the things required to make working software (writing, testing, compiling, linking, debugging, organising projects and libraries), whilst a text editor is designed to edit text. But sometimes text editors get mission creep.

vim and emacs are both editors with long pedigree on Unix systems. vim‘s parent, vi came into being in 1976, with vim being born in 1991, vim stands for “Vi Improved”. Emacs was also born in 1976. Glancing at the emacs wikipedia page I see there are elements of religiosity in the conflict between them.

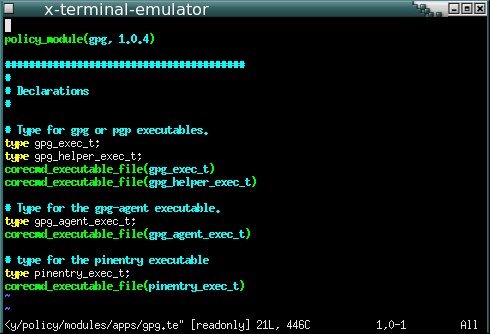
To users of OS X and Windows, vim and emacs look and feel, frankly, bizarre. They came into being when windowed GUI interfaces didn’t exist. In basic mode they offer a large blank screen with no icons or even text menu items. There is a status line and a command line at the bottom of the screen. Users interact by issuing keyboard commands, they are interfaces with only keyboard shortcuts. It’s said that the best way to generate a random string of characters is to put a class of naive computer science undergraduates down in front of vim and tell them to save the file and exit the program! In fact to demonstrate the point, I’ve just trapped myself in emacs  whilst trying to take a screen shot.

selinux_vim_0

vim, image by Hermann Uwe

GNU emacs-[1]

emacs, image by David Mundy

vim and emacs are both incredibly extensible, they’re written by coders for coders. As a measure of their flexibility: you can get twitter clients which run inside them.

I’ve used both emacs and vim but not warmed to either of them. I find them ugly to look at and confusing, I don’t sit in front on an editor enough of the day to make remembering keyboard shortcuts a comfortable experience. I’ve used the Matlab, Visual Studio and Spyder IDEs but never felt impassioned enough to write a blog post about them. I had a bad experience with Eclipse, which led to one of my more valued Stackoverflow answers.

But now I’ve discovered Sublime Text.

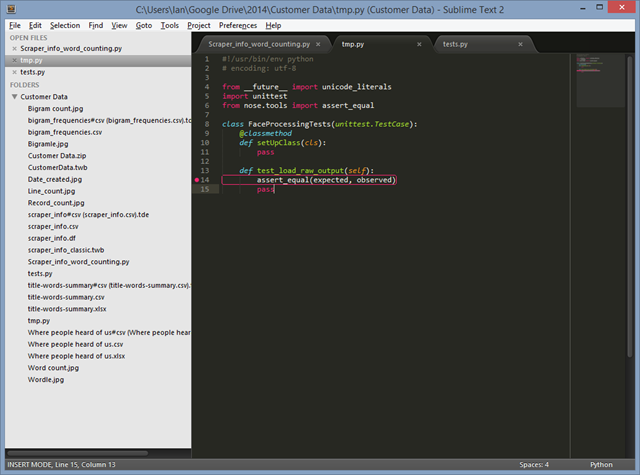
Sublime Text is very beautiful, particularly besides vim and emacs. I like the little inset in the top right of my screen which shows the file I’m working on from an eagle’s perspective, the nice rounded tabs. The colour scheme is subtle and muted, and I can get a panoply of variants on the theme. At Unilever we used to talk about trying to delight consumers with our products – Sublime Text does this. My only wish is that it went the way of Google Chrome and got rid of the Windows bar at the top.

Not only this, as with emacs and vim, I can customise Sublime Text with code or use other packages other people have written and in my favoured language, Python.

I use Sublime Text mainly to code in Python, using a Git Bash prompt to run code and to check it into source control. At the moment I have the following packages installed:

  • Package Control – for some reasons the thing that makes it easy to add new packages to Sublime Text comes as a separate package which you need to install manually;
  • PEP8 Autoformat – languages have style guides. Soft guidelines to ensure consistent use of whitespace, capitalisation and so forth. Some people get very up tight about style. PEP8 is the Python style guide, and PEP8 autoformat allows you to effortlessly conform to the style guide and so avoid friction with your colleagues;
  • Cheat Sheets – I can’t remember how to do anything, cheat sheets built into the editor make it easy to find things, and you can add your own cheat sheets too;
  • Markdown Preview – Markdown is a way  of writing HTML without all the pointy brackets, this package helps you view the output of your Markdown;
  • SublimeRope – a handy package that tells you when your code won’t run and helps with autocompletion. Much better than cryptic error messages when you try to run faulty code. I suspect this is the most useful one so far.
  • Git and GitGutter – integrating Git source control into the editor. Git provides all the Git commands on a menu whilst GitGutter adds markers in the margin (or gutter) showing the revision status. These work nicely on Ubuntu but I haven’t worked out how to configure them on Windows.
  • SublimeREPL – brings a Python prompt into the editor. There are some configuration subtleties here when working with virtual environments.

I know I’ve only touched the surface of Sublime Text but unlike other editors I want to learn more!

Book Review: Visualize This by Nathan Yau

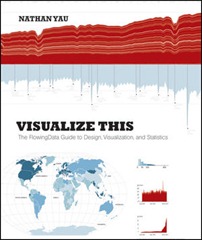
9780470944882 cover.inddThis book review is of Nathan Yau’s “Visualize This: The FlowingData Guide to Design, Visualization and Statistics”. It grows out of Yau’s blog: flowingdata.com, which I recommend, and also his experience in preparing graphics for The New York Times, amongst others.

The book is a run-through of pragmatic methods in visualisation, focusing on practical means of achieving ends rather more abstract design principles for data visualisation; if you want that then I recommend Tufte’s “The Visual Display of Quantitative Information”.

The book covers a bit of data scraping, extracting useful numerical data from disparate sources, as Yau comments this is the thing that takes the time in this type of activity. It also details methods for visualising time series data, proportions, geographic data and so forth.

The key tools involved are the R and Python programming languages; I already have these installed in the form of R Studio and Python(x,y), distributions which provide an environment that looks like the Matlab one with which I have long been familiar with but which sadly is somewhat expensive for a hobby programmer. Alongside this are the freely available Processing language and the Protovis Javascript library which are good for interactive, online visualisations, and the commercial packages Adobe Illustrator, for vector graphic editing, and Adobe Flash Builder for interactive web graphics. Again these are tools I find out of my range financially for my personal use although Inkscape seems to be a good substitute for Illustrator.

With no prior knowledge of Flash and no Flash Builder, I found the sections on Flash a bit bewildering. It also highlights how perhaps this will be a book very distinctively of its time, with Apple no longer supporting Flash on iPhone its quite possible that the language will die out. And I notice on visiting the Protovis website that this is no longer under development: the authors have moved on to D3.js, Openzoom which is also mentioned is no longer supported. Python has been around for sometime now and is the lightweight language of choice for many scientists, similarly R has been around for a while and is increasing in popularity.

You won’t learn to program from this book: if you can already program you’ll see that R is a nice language in which to quickly make a wide range of plots. If you can’t program then you may be surprised how few commands R requires to produce impressive results. As someone who is a beginner in R, the examples are a nice tour of what is possible and some little tricks, such as the fact that plot functions don’t take data frames as arguments: you need to extract arrays.

As well as programming the book also includes references to a range of data sources and online tools, for example colorbrewer2.org – a tool for selecting colour schemes, and links to the various mapping APIs.

Readers of this blog will know that I am an avid data scraper and visualiser myself, and in a sense this book is an overview of that way of working – in fact I see I referenced flowingdata in my attempts to colour in maps (here).

The big thing I learned from the book in terms of workflow is the application of a vector graphics package, such as Adobe Illustrator or, Inkscape, to tidy up basic graphics produced in R. This strikes me as a very good idea, I’ve spent many a frustrating hour trying to get charts looking just right in the programming or plotting language of my choice and now I discover that the professionals use a shortcut! A quick check shows that R exports to PDF, which Inkscape can read.

Stylistically the book is exceedingly chatty, including even the odd um and huh, which helps make it quick and easy read although is a little grating. Many of the examples are also available over on flowingdata.com, although I notice that some are only accessible for paid membership. You might want to see the book as a way of showing your appreciation for the blog in physical and monetary form.

Look out for better looking visualisations from me in the future!

House of Lords register of members interests

This post is about the House of Lords register of members interests, an online resource which describes the financial and other interests of members of the UK House of Lords. This follows on from earlier posts on the attendance rates of Lords, it turns out 20% of them only turn up twice a year. I also wrote a post on the political  breakdown of the House and the number of appointments to it in each year over the period since the mid-1970s. This is all of current interest since reform is in the air for the House of Lords, on which subject I made a short post.

I was curious to know the occupations of the Lords, there is no direct record of occupations but the register of members interests provides a guide. The members interests are divided into categories, described in this document and summarised below:

Category 1 Directorships
Category 2 Remunerated employment, office, profession etc.
Category 3 Public affairs advice and services to clients
Category 4a Controlling shareholding
Category 4b Not a controlling shareholding but exceeding £50,000
Category 5 Land and property, capital value exceeding £250,000 or income exceeding £5,000 but not main residence
Category 6 Sponsorship
Category 7 Overseas visits
Category 8 Gifts, benefits and hospitality
Category 9 Miscellaneous financial interests
Category 10a Un-renumerated directorship or employment
Category 10b Membership of public bodies, (hospital trusts, governing bodies etc)
Category 10c Trusteeships of galleries, museums and so forth
Category 10d Officer or trustee of a pressure group or union
Category 10e Officer or trustee of a voluntary or not-for-profit organisation


The values of these interests are not listed but typically the threshold value for inclusion is £500 except where stated.

The data are provided as webpages, with one page per initial letter there are no Lords whose Lord Name starts with X or Z. This is a bit awkward for carrying out analysis so I wrote a program in Python which reads the webpages using the BeautifulSoup HTML/XML parser and converts them into a single Comma Separated Value (CSV) file where each row corresponded to a single category entry for a single Lord – this is the most useful format for subsequent analysis.

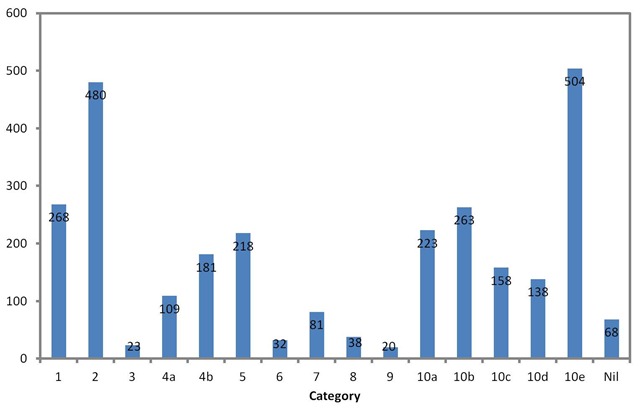
The data contains entries for 828 Lords, which translates into 2821 entries in the big table. The chart below shows the number of entries for each category.


CategoryBreakdown

This breaks things down into more manageable chunks. I quite like the miscellaneous category 9, where people declare their spouses if they are also members of the House and Lord Edmiston who declares “Occasional income from the hiring of Member’s plane”. Those that declare no interests are split between “on leave of absence”, “no registrable interests”, “there are no interests for this peer” and “information not yet received”. The sponsorship category (6) is fairly dull, typically secretarial support from other roles.

Their Lordships are in great demand as officers and trustees of non-profits and charities, as indicated by category 10e, and as members on the boards of public bodies (category 10b).

I had hoped that category 2 would give me some feel for occupations of Lords, I was hoping to learn something of the skills distribution since it’s often claimed that the way in which they are appointed means they bring a wide range of expertise to bear. Below I show a wordle of the category 2 text.Wordle of category 2 interests textThere’s a lot of speaking and board membership going on unfortunately it’s not easy to pull occupations out of the data. I can’t help but get the impression that the breakdown of the Lords is not that dissimilar to that of the Commons, indeed many Lords are former MPs – this means lots of lawyers.

You can download the data in the form of a single file from Google Docs here. I’ve added an index column and the length of the text for each entry. Viewing as a single file in this compact format is easier than the original pages and you can do interesting things such as sort by different columns or search the entire file for keywords (professor, Tesco, BBC… etc). The Python program I wrote is here.