Revisions to UK GDP data

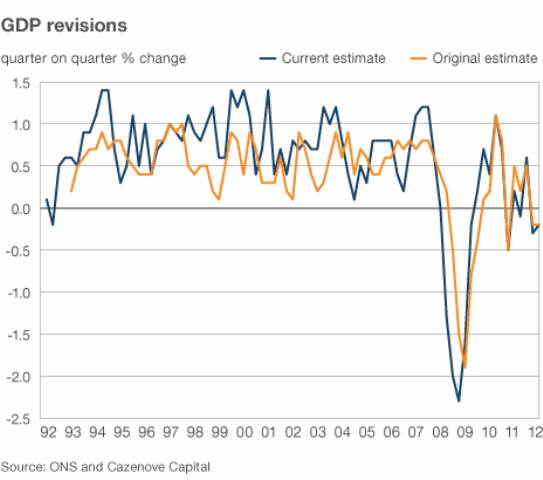
The BBC published an article entitled “Viewpoint: Is UK GDP data fit for purpose?” which featured a graph showing the original estimates for quarterly UK GDP growth and current estimates for those same figures. The point being that the original figures are subject to revision which can change figures quite significantly, for example currently we are technically in recession with a GDP growth figure for Q1 2012 of –0.2% (source). But how does this compare with the size of the revisions made to the data?

Here is the graph from the original article:

464

This is quite nice but there are other ways to display this data, which unfortunately isn’t linked directly to the graph. However, this should not stop an enterprising number-cruncher, there exists software which will allow you to extract the numbers from graphs! I used Engauge Digitizer, which worked fine for me – I had the data I wanted 20 minutes or so after I’d downloaded the software. It does some semi-automatic extraction which makes separating the two different sets of data in the graph on the basis of the colour of the lines quite easy.

This type of approach is not ideal, the sampling interval for the extracted data is not uniform, and not the same for the two datasets, furthermore the labelling of the x-axis is unclear so it’s difficult to tell exactly which quarter is referred to.

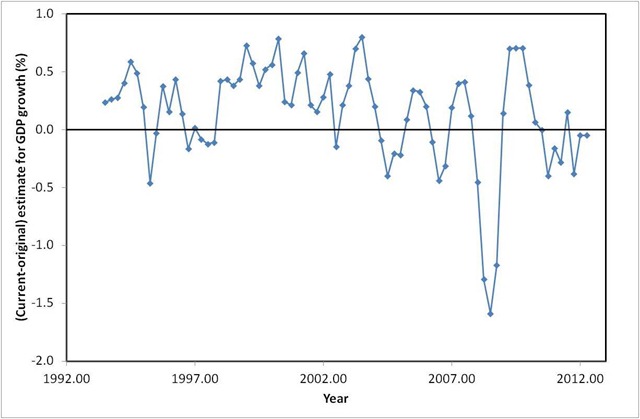
I next loaded up the data into Excel for a bit of quick and easy plotting. To address the sampling problem I used the vlookup function to give me data for each series on a quarterly basis. I can then plot interesting things like the difference between the current and original estimates for each quarter, as shown below:

DifferenceGraph

A few spot checks referring back to the original chart can convince us that we have scraped the original data moderately well. The data also fit with the ONS comment on the article:

…looking back over the last 20 quarters, between the first and most recent estimates, the absolute revision (that is, ignoring the +/- sign) is still only 0.4 percentage points.

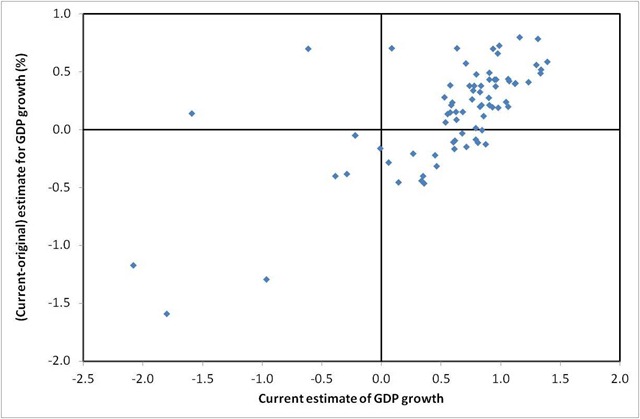
I calculated this revision average and got roughly the same result.We can also plot the size of revisions made as a function of the current estimate of the GDP growth figure:

DifferenceGraph2

This suggests that as the current estimate of growth goes up so does the size of the revision: rises are under-estimated, falls in growth are under-estimated in the first instance although this is not a statistically strong relationship. These quarterly figures on GDP growth seem awfully noisy, which perhaps explains some of the wacky explanations for them (snow, weddings, hot weather etc etc) – they’re wild stabs at trying to explain dodgy data which doesn’t actually have an explanation.

The thing is that the “only 0.4 percentage points” that the ONS cites makes all the difference between being in recession and not being in recession!

Footnotes

I uploaded my spreadsheet here, the figures did not import well.

Doppelgänger…

IMG_17062-3 weeks

What handsome chaps! Left is Thomas, aged 11 weeks – right is me aged 2-3 weeks.

Book Review: Stargazers by Fred Watson

41W3OswkqxL._SS500_This post is a review of “Stargazers:The Life and Times of the Telescope” by Fred Watson. It traces the history, and development of the telescope from a little before its invention in 1608 to the present day.

The book begins its historical path with Tycho Brahe, a Danish astronomer who lived 1546-1601. He built an observatory, Uraniborg, on the Danish island of Hven in view of his patron, King Frederick II of Denmark. Brahe’s contribution to astronomy were the data which were to lead to Johannes Kepler’s laws of planetary motion and ultimately Isaac Newton’s laws of gravitation. On the technical side his observatory represented the best astronomy of pre-telescope days with the use of viewing sights, his Great Armillary with it axis aligned with that of the earth and graduated scales to measure angles. Watson also cites him as a first instance of a research director running a research institute – alongside the observatory he ran a print works to disseminate his results.

The telescope was first recorded in September of 1608, when Hans Lipperhey presented one to Prince Maurice of Nassau in the Netherlands. Clearly it was a device of its time since in very short order several independent inventions appeared, Galileo constructed his own version which led to his publication of “The Starry Messenger” in 1610 which reports his observations using the device. The telescope grew out of the work of spectacle makers; there are some hints of the existence of telescope-like devices in the latter half of the 16th century but these are vague and unsubstantiated. Roger Bacon and Robert Grosseteste both conceived of a telescope-like device in the 13th century, around the time the first spectacles were appearing. Although there are a few lenses from antiquity there is no good evidence that they had been used in telescopes.

The stimulus for the creation of the first telescopes seems to have been a combination of high quality glass becoming available, and skilled lens grinders. The lens making requirements for telescopes are much more taxing than for spectacles. The technology required is not that advanced, if you look around the web you’ll find a community of amateur astronomers grinding their own lenses and mirrors now using fairly simple equipment, typically a turntable with a secondary wheel which produces linear motion for the polishing head back and forward across the turning lens blank. The most technologically advanced bit is probably captured in the first step: “acquire your glass blank”.

Through the 17th century refracting telescopes were built of ever greater length in an effort to defeat chromatic aberration which arises from the differential refraction of light as a function of wavelength (colour) – long focal length lenses suffered from less chromatic aberration than the shorter focal length ones which would allow a shorter telescope. Johannes Hevelius made telescopes of 46m focal length (physically the telescope would be a little shorter than this), mounted on a 27m mast; Christiaan Huygens dispensed with the “tube” of the telescope entirely and made “aerial telescopes” with even longer focal lengths, up to 64m.

It was known through the work of Alhazen in the 10-11th century, and others, that reflecting, curved-mirrors could be used in place of lenses. A telescope constructed with such mirrors would avoid the problem of chromatic aberration. However, the polishing tolerances for a reflecting telescope are four times higher than that of a lens. Newton built the first model reflecting telescope in 1668 but no-one was to repeat the feat until John Hadley in 1721.

Theoretical understanding of telescopes developed rapidly in the 17th century both for refracting and reflecting telescopes, indeed for reflecting telescopes there were no fundamental advices in the theory between 1672 and 1905. The problem was in successfully implementing theoretical proposals. Newton claimed that chromatic aberration could not be resolved in a refracting telescope, however he was proved wrong by Chester Hall Moor in 1729, and somewhat controversially by John Dollond in 1758 who was able to obtain a patent despite this earlier work (which was defended aggressively by his son) – the trick is to build compound lenses comprised of glass of different optical properties.

Also during the 18th century the construction of reflecting telescopes became more common, William Herschel started building his own reflecting telescopes in 1773 with the aid of Robert Smith’s “Compleat system of opticks”. Ultimately he was to build a 40ft (12m) telescope with a 48 inch (1.2m) mirror in 1789, supported by a grant from George III. During his lifetime Herschel was to discover the planet Uranus (nearly called George in honour of his patron), numerous comets and nebulae. At the time “official” astronomy was more interested in the precise measurement of the positions of stars for the purpose of navigation. Herschel was to be followed by Lord Rosse with his 1.8m diameter mirror telescope built in 1845 at Birr Castle, this has been recently restored (see here). He too was interested in nebula and discovered spiral galaxies.

During the 19th century there were substantial improvements in the telescope mounts, with engineers gaining either an amateur or professional interest (men such as James Nasmyth and Thomas Grubb). Towards the end of the century photography became important, which placed more exacting standards for telescope mounts because to gain maximum benefit from photography it was necessary to accurately track stars as they moved across the sky to enable long exposure times. This is also the century in which stellar spectrography became possible with William Huggins publishing the spectra of 50 stars in 1864. Léon Foucault invented the metal coated glass mirror in 1857 which were lighter and more reflective than the metal mirrors used to that point. As the century ended the largest feasible refracting telescopes with lens diameters of 1m were just around the corner, above this size a lens distorts under its own weight reducing the image quality.

In 1930 Bernhard Schmidt designed a reflecting telescope which avoided the problem of aberrations away from the centre of the field of view making large field of view “survey” telescopes practicable. As a youth in the 1970s I learnt of the 200-inch (5 metre) Hale telescope at Mount Palomar, since then space telescopes able to see in the infra-red and ultra-violet as well as the visible have escaped the distortion the atmosphere brings; adaptive optics are used to counteract atmospheric distortion for earthbound telescopes and there are “distributed” interferometric telescopes which combine signals from several telescopes to create a virtual one of unfeasible size.

Watson mentions briefly radio telescopes and in the final chapters speculates on developments for the future and gravitational lensing – natures own telescopes built from galaxies and spread over light years.

I enjoyed “Stargazers” as a readable account of the history of the telescope which left me with a clear understanding of its principles of operation and the technological developments that enabled its use, it also provides a good jumping off point for further study.

Footnotes

My Evernotes for the book are here, featuring more detailed but slightly cryptic notes and links to related work.

Bad polling

Bullied teachers fear culture of ‘macho managers’. Union survey shows 67% were affected by abuse and harassment from their colleagues

The Observer 08.04.12

This is the headline and subtitle to an article in The Observer today. Sound terrible doesn’t it? If I were working in an organisation where 67% of the staff were being bullied I’d probably want to leave, and I’d certainly expect senior management to be addressing the problem. Fortunately I suspect this headline is almost entirely misleading.

Firstly, the first line of the article says “more than two-thirds of teachers have experienced or witnessed workplace bullying in the past 12 months” (my emphasis) – so one teacher shouting at a colleague in a busy staffroom would generate an awful lot of “yes” votes.

Secondly, it’s described as an “online poll”, giving no information on the nature of the poll. If the respondents are randomly selected then fine, however if they are self-selected then it’s close to meaningless.

It’s possible that the level of bullying of teachers by their colleagues is at the level implied by the headline, but they’ve been done a great dis-service by their union and The Observer in the poor example of polling and reporting.

You’d have thought The Observer would have learnt its lesson by now, having published a mea culpaWhen is a poll not a poll?” over a headline claiming “Nine out of 10 members of Royal College of Physicians oppose NHS bill” which highlighted exactly the issue with self-selecting surveys.

Board of Longitude

It’s been a while since I did a data driven blog post, so here I am with one on the “Board of Longitude”. The board was established by act of parliament in 1714 with a headline prize of £20,000 to anyone who discovered a method to determine the longitude at sea to within 30 nautical miles. The members of the Board also had discretion to make smaller awards of up to £2,000 in support of proposals which they thought had merit. The Board was finally wound up in 1828, 114 years after its formation.

The latitude is your location in the North-South direction between the equator and either of the earth’s poles, it is easily determined by the position of the sun or stars above the horizon, and we shall speak no more of it here.

The longitude is the second piece of information required to specify ones position on the surface of the earth and is a measure your location East-West relative to the Greenwich meridian. The earth turns at a fixed rate and as it does the sun appears to move through the sky. You can use this behaviour to fix a local noon time: the time at which the sun reaches the highest point in the sky. If, when you measure your local noon, you can also determine what time it is at some reference point Greenwich, for example, then you can find your longitude from the difference between the two times.

The threshold for the highest Longitude award amounts to knowing the time at Greenwich to within 2 minutes, wherever you are in the world, and however you got there. This was a serious restriction at the time, because a journey to anywhere in the world could have taken months of voyaging at sea with its concomitant vibrations and extremes of temperature, pressure and humidity all of which have serious implications for precision timekeeping devices.

The Board of Longitude intertwines with various of the people whose biographies I’ve read, and surveying efforts taking place during the 18th and 19th centuries. It made a walk on appearance in Tim Harford’s Adapt, which I’ve just read, as an early example of prizes being offered to solve scientific problems.

Below I present data on the awards made by the Board during its existence from 1714 to 1828. The data I have used is from “Britain’s Board of Longitude: The Finances, 1714-1828” By Derek Howse1 which I reached via The Board of Longitude Project based at the Royal Museums at Greenwich. The chart below shows the cumulative total of the awards made by the Board (blue diamonds), awards made to John Harrison who won the central prize of the original Board (black triangles) and the dates of Acts of Parliament relating to the Board (red squares). Values are presented as at the time they were awarded, the modern equivalent values are debatable but the original £20,000 award is said to have been worth between £1million and £3.5million in modern terms, so a rule of thumb would be to multiple by 100 to get approximate modern values.

image

Although established in 1714, the Board made no reward until 1737 and until 1765 made the great majority of awards to John Harrison for his work on clocks; clockmakers Thomas Earnshaw (1800, 1805), Thomas Mudge (1777,1793) and John Arnold (father and son 1771-1805) also received significant sums from the Board.

A second area of awards was in the “lunar” method of determining the longitude which uses the positions of stars relative to the moon to determine time and hence longitude. The widow of Tobias Mayer received the largest award, £3,000, for work in this area. The list of awardees contains a number of famous European mathematicians including Leonhard Euler, Friedrich Bessel, and Johann Bernoulli.

After 1763 the Board started to branch out, having been mandated by parliament to prepare and print almanacs containing astronomical information. In the twilight of its years the Board gained responsibility for awards relating to the discovery of the North-West passage (a sea route from the Atlantic to the Pacific via the north of Canada), the second largest recipient of awards for the whole period were the crews of the Hecla and Griper of £5000 in 1820 for reaching 110oW within the Arctic Circle, pursuing this goal.

The story of the Board of Longitude is often presented as a battle between the Board and John Harrison for the “big prize” but these data highlight a longer and more subtle existence with Harrison receiving support over an extended period and the Board going on to undertake a range of other activities.

References

1. “Britain’s Board of Longitude: The Finances, 1714-1828” By Derek Howse, The Mariner’s Mirror, Vol. 84(4), November 1998, 400-417. (pdf) Sadly the article notes that Derek Howse died after the preparation of this article.

2. Data from (1) can be found in this Google Docs spreadsheet