Category: Technology

Programming, gadgets (reviews thereof) and computers

Celestron NexStar 5Se – a 125mm reflecting telescope

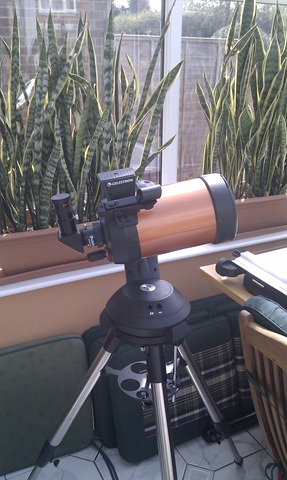
CelestronNexStar5SEThis is a brief overview of my shiny new purchase: a Celestron NexStar 5SE telescope. As an experiment I have also embedded a video review (here), I should also point out that so far cloud cover has meant the only celestial object I have observed is the sun (using the appropriate safety measures).

I bought my ‘scope from Sherwood’s, who I am happy to recommend for their good prices, and quick and efficient service. My purchase list was as follows:

  • Celestron NexStar 5SE (with mains adaptor)
  • SLA AstroPower station 12v 7Ah battery pack
  • Piggyback mount for my Canon 400D SLR
  • Universal camera adaptor and T-mount for similar
  • Moon filter
  • Baader solar filter film

The mount is powered, the add-on battery pack seemed like the best option for providing that power conveniently. I have a Canon 400D SLR camera which I wanted to use with the telescope, the piggyback mount lets me put the camera on top of the optical tube and simply use it to point the camera at the sky. The T-mount assembly allows me to use the telescope as a camera lens, albeit without auto-focus and aperture.

The solar filter is essential if you want to look at the sun, and I got the impression a moon filter was useful for dimming the brightness of the moon, photographers will know that when photographing the moon the exposure time is as if for a rock sitting in full sun, which is exactly what it is!

The 5SE is a Schmidt-Cassegrain telescope with a 125mm (5 inch) primary mirror, a focal length of 1250mm and an overall F/ratio of 10. “Schmidt-Cassegrain” means that the open end of the tube has a corrector plate (Schmidt’s contribution) and light is focussed by a large concave primary mirror and a smaller convex secondary mirror in the centre of the corrector plate. The image is viewed through an eyepiece in the back of the optical tube, behind the primary mirror. In practical terms it also means the telescope has a very short tube length making it more portable than similarly specified telescopes. The whole assembly is easy to pick up and carry in its deployed state, and the optical tube in particular was well-packed on delivery forming the basis of a useful carrycase.

The telescope is supplied with a 25mm focal length eyepiece which gives a magnification of x50, the maximum useful magnification of the telescope should be x300 with appropriate eyepiece. Focus is achieved by turning a knob on the back plane of the telescope tube, which moves the primary mirror. The eyepiece is attached to a periscope (Star Diagonal in Celestron’s parlance) to give a more comfortable viewing position. The finderscope is a Celestron Star Pointer, which is a non-magnifying window with an LED spot projected to the middle for guiding, it took me a little while to get the hang of this but I can see the benefit of a low magnification finderscope.

The telescope is on a computerized alt-azimuth mount which also includes an equatorial wedge (like the equatorial platform), meaning that the rotational motion of the mount can be made co-axial with that of the earth – allowing un-rotated tracking of objects through the sky for astrophotographic purposes. The controller is a handset device on a cord, in night time operation the telescope can be aligned to the night sky by pointing it to three different stars, after which it will goto any one of a huge catalogue of celestial objects selected using the handset.

The optical tube feels nice and chunky, although the finderscope is a bit plasticky. The piggyback mount attaches using the same mounting holes as the finderscope, the finderscope then bolts back on top, I did a bit of tweaky of the screws along with adjustments on the finderscope to get it aligned. I have achieved fine views of my neighbours chimney pot!

There is a battery compartment in the mount which takes 8xAA batteries, reading on the internet I understand the lifetime for this set is about 30 minutes in operation, which is why I got both a mains adaptor and a 3rd party battery pack. I suspect I’ll mainly use the add-on battery pack for the convenience of fewer trailing leads. The mount doesn’t operate without power, which is a bit of a drawback, the telescope can be tilted but not rotated. The mount sits on top of a nice chunky tripod, to which it is attached by three screws, so in principle you could make yourself a “manualised” version by sitting the scope on a turntable. I have the slightly spurious desire to see a graduated scale on the mount movements. I’m used to using research grade optical equipment and whilst the optics have that feel about them the mount, although functional, does not.

The telescope comes with TheSkyX (First Light edition) planetarium software, and also an application called “NexRemote” which seems to allow you to control the telescope using a virtual version of the handset on screen – this seems a bit pointless to me! Other telescope control software is available, and it appears there is an interface standard. The programmer in me is hankering to write my own controller software!

Overall I’m pleased with my new purchase but desperate for a slightly less cloudy night to try it out properly – no doubt more blog posts to follow once I’ve done this! Even at £650 for the telescope it is cheaper than many lenses for my Canon SLR, although it is a little chastening that John Hadley’s 1721 reflecting telescope had a larger primary mirror.

Update:

After a few weeks of twilight use I thought it might be useful to add a couple of further comments which don’t really make a full new blog post:

1. You can get and set the telescope azimuth and altitude directly using the appropriate entries in the Utilities menu, without alignment these values are based on an assumed initial position of 0,0. During the hours of daylight, when only a very limited number of celestial bodies may be visible, you can carry out a “single body” alignment using the “Solar System Align” option in Alignment. This allows you to enable tracking, and to Goto specified absolute coordinates – useful if you want to survey heights of neighbouring obstructions.

2. The 5SE does not support autoguiding whilst the 6SE and 8SE do. The NexStar range does seem a bit confusing in terms of the facilities available across the range, the 5SE for another example is the only one to have a built-in equatorial wedge.

Here is a video tour, which covers much of what I’ve written above but includes the sound of me tripping over the cat’s water bowl:

 

Case-sensitive

As a long time programmer there is a little thing I’d like to rant about: case-sensitivity.

For the uninitiated this is the thing that makes your program think that the variable called “MyVariable” is different from the variable called “myVariable” and the variable called “Myvariable”. The problem is that some computer languages have it and some computer languages don’t.

I grew up with BASIC and later FORTRAN, case-insensitive languages which do the natural thing and assume that capitalisation does not matter. Other languages (C#, Java, C, Matlab) are not so forgiving and insist that “a” and “A” refer to two completely different things. In real life this feels like a wilful act of obstinacy, the worst excesses of teenage pedantry, it is a user experience fail.

The origins of case-sensitivity lie in the origins of the language C in the early 1970s,  FORTRAN doesn’t have it because when it was invented, in the dawn of computing, teletype printers did not support lowercase – there was no space on the print head.  I still think of FORTRAN as a language written in ALL CAPS and so rather IMPERATIVE.

There is an argument for case-sensitivity from the point of view of compactness; mathematicians, even of my relatively lowly level will name their variables in equations with letters from the Roman and Greek alphabets, subscripts and superscripts. My father, an undergraduate mathematician, even went as far as Cyrillic alphabet. Sadly the print media, even New Scientist, do not support such typographically extravagance.

It’s even worse when your language is dynamically-typed, that’s to say it allows you to create variables willy-nilly as you write your program rather than statically-typed languages which demand you tell them explicitly of the introduction of new variables. In a statically typed language if you start with a variable called “MyVariable” and later introduce “Myvariable”, by a slip of the key, then the compiler will kick-off: complaining it has no knowledge of this interloper. A dynamically-typed language will accept this new introduction silently, giving it a default value and causing untold damage in subsequent calculations.

It’s not like case-sensitivity is used in any syntactically meaningful manner: to a computer there is no practical difference between “foo” and “Foo” – the standard placeholder function name, foo” and “Foo” to the computer are simply the label you have stuck to a box containing a thing. There are some human conventions, but they are just that – and as with any convention they are honoured as much in the breech as the observance. The compiler doesn’t care.

I must admit to a fondness of CamelCase: capitalising the initial letters of each word in a long variable name, I do it in my hashtags on twitter. In the old days of FORTRAN no such fripperies existed, not only were your variable names limited in case but also in length: you had 6 characters to work your magic.

This is to ignore the many and varied uses different uses that computer languages find for brackets: {}, (), [] and even <>.

British Wars–presented in fancy Javascript timeline format

Working my way through various bits of scientific history it becomes clear that what is going on outside the lab can have a profound impact on the protagonists. For the early years of the Royal Society the English Civil War and the Restoration had a big impact on the Fellows; the general feeling was “never again” and there was a search for stability and order. Later, in the 18th century, the American War of Independence and the subsequent wars arising from the French Revolution had an impact on The Lunar Men, impacting as it did on trade and their own radical politics. Lavoisier was to find the French Revolution terminal. In the 20th century, scientists were to play a large role in the Second World War; in codebreaking, radar and in building the atomic bomb. This followed a lesser role in the First World War, developing chemical weapons.

As someone whose formal education in history ended at the age of fourteen I thought I should get a feel for the wars going on around the people closer to my interests; this also seemed to be a good opportunity to play with whizzy Javascript timeline technology courtesy of Simile. It turns out the tricky bit is getting Javascript to run inside WordPress, I cheated a little by simply installing the Simile timeline plugin which fixed things in a way I don’t pretend to understand.

The timeline below is derived from a page in wikipedia entitled British Wars, I wanted to go back to the beginning of the 17th century so I supplemented that list with the linked “List of wars involving England”; Great Britain did not exist prior to the Acts of Union in 1707. You can slide the timeline backwards and forth by dragging it with the mouse.


Javascript timeline broken on upgrade to WordPress 3.5, you can see it here now.

I’ve colour coded the wars geographically as follows civil war: blue, Africa: brown, European:green, Americas:red, India:olive, SE Asia:black, New Zealand:purple and Middle East:orange, I have done this slightly erratically. During the 19th century we appear to have engaged in an awful lot of colonial conflicts around the world.

Developing this timeline I have experienced some of the shortcomings of the timeline presentation, I started off with the Cast of Characters in Lisa Jardine’s “Ingenious Pursuits”, entering their birth and death dates, but quickly found I had a rather ugly pile of people whose lives centred around 1680 with outliers before and after that time. Once I started on “British Wars” a second drawback becomes apparent: what is important and what isn’t? In a sense I gave up this decision to the compilers of the Wikipedia page, blindly adding all they had put in. This means the Cod Wars appears alongside the First World War implying some sort of equivalence. They also rate “The Troubles” in Northern Ireland as a war which I struggle to admit.

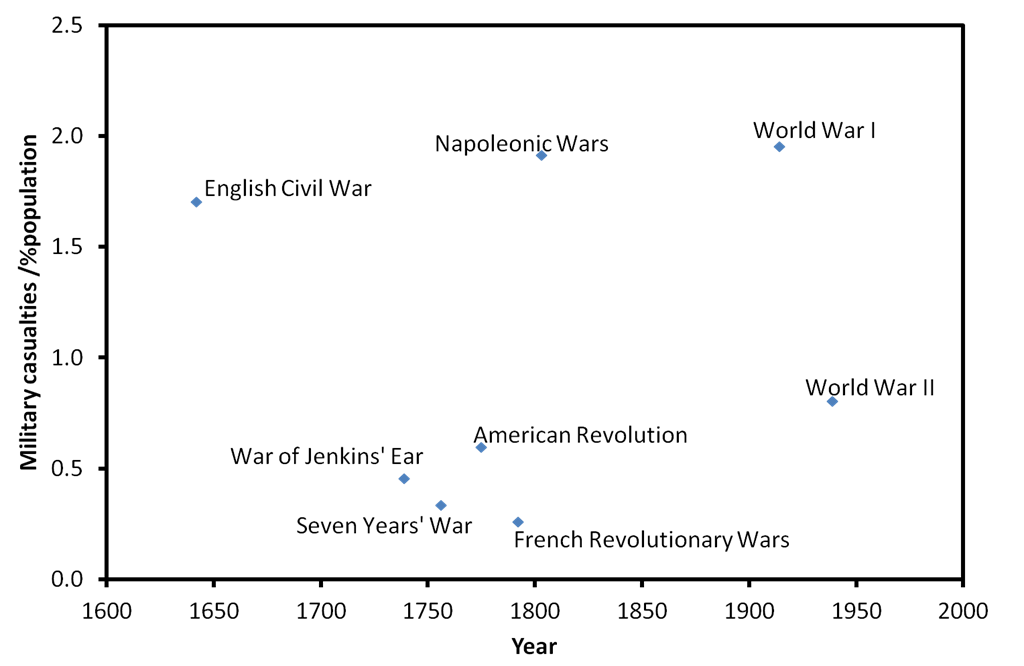
As a second exercise I tried working out how “important” a war was through numbers of military casualties, for this exercise the full list of British Wars is a bit long so again I left the deciding what was important to someone else, in this case a BBC History timeline, this finds a more manageable 10 major wars over the last 400 years or so. In fact it turns out that the Crimean and Boer Wars had relatively few military causalities, so I have omitted them. Below you can see the number of causalities for each war, expressed as a fraction of the population at that time. The casualty figures come from a combination of Wikipedia and Necrometrics, the population figures from the Historical Atlas.

WarCasualties

This plot lumps together a whole sequence of conflicts from the first plot into “Napoleonic Wars”. I’ve always known that World War I was known as the war to end all wars, that the casualty figures were horrific, but hadn’t appreciated that the Napoleonic Wars were similar in scale compared to the size of the population. Similarly the English Civil War scores highly for casualties but even so is under-represented in this plot since I decided to use the military casualty figures rather than total deaths relating to the war i.e. including civilians and those who died of disease or famine.

This is a rather parochial view but it has got the sequence of wars Britain has undertaken into some sort of chronology for me.

Get Organised!

This is a post about how I record my research, I write it in the hope that others will reveal some of themselves and perhaps gain something from the writing. I write it because how exactly people work is something of a mystery.

This seems like something I’ve picked up slowly over many years rather than being taught it all in one big bang as an undergraduate. I suspect there may have been attempts to teach me this, but sometimes it takes getting it horribly wrong for you to learn stuff, like the importance of backing up your files.

Clearly scientific literature (including company internal reports) has always been important to my work. I wrote a little bit about scientific publication a while back (here). Generation 1 of my filing system was Windows 3.1’s Cardfile program which I used at the start of my PhD, for each paper I photocopied I typed the details onto an index card. I wrote a sequence number on the corner of each printed paper along with a couple of keywords which I also enter into whatever indexing system I’m using and filed it away in a filing cabinet, ordered by the sequence number. These days most papers are available as PDF and I file this in a directory with the sequence as the first part of the filename.

After Cardfile I moved on to Endnote, and currently I use Reference Manager which are more specialist pieces of software specifically designed for storing the details of publications and also formatting bibliographies in popular wordprocessing packages. Notes on the contents of a paper still get scribbled onto the paper copy in red ink…

These days Zotero and Mendeley both look like good free options for reference management. I haven’t switched to Zotero because it’s currently tied to the Firefox browser and I haven’t switched to Mendeley because I’m not absolutely certain what it is syncing to the Cloud and what other people can see of it there, exposing even the titles of internal company reports to outsiders is a Very Bad Thing. I also had some minor problems importing my legacy collection into Mendeley. Unlike previous iterations of such software Zotero and Mendeley both make reasonable attempts at extracting paper details from PDF files or webpages.

Stray bits of paper scribbled on at meetings I still haven’t really cracked, I try to write the date and a sequence number on any bit of paper I use, and some link to the project it relates too but this is unsatisfying. For many years I’ve considered scanning in bits of paper; our company photocopiers will e-mail scans of paper to you in PDF format and with harddisk space being so cheap now* it seems odd not to do this. All this means I still have a folder per project where bits of paper end up. And, truth be told, I still find it easier to comment on a bit of work by scribbling on a bit of paper.

I’ve started using OneNote a bit for odd note collecting, the OneNote metaphor is of a collection of notebooks, each notebook is divided into sections by tabs along the top of the page and each section is divided further into pages using tabs down the righthand side of the page. My main problem with OneNote is that it’s not possible to display your notes in date order, I seem to use it mainly for a jumping off point to other things.

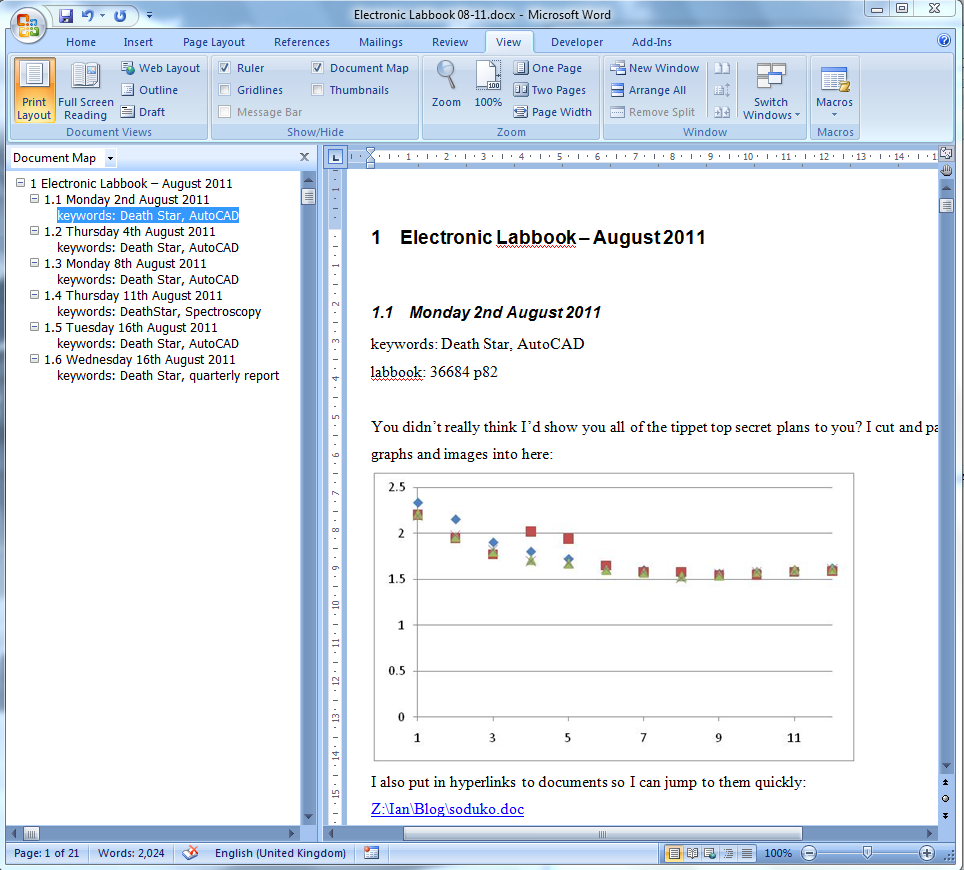
My lab books have been the core of my research since I started my PhD., in my loft there’s a sequence of about 20 of them. Some of my colleagues have fantastically neat lab books with diagrams and graphs carefully sellotaped in and orderly paragraphs describing the experiments done, I never really got that well organised but I did a fair job of adding to an index at the front of each one.  I still use paper lab books today but at a reduced rate. I’ve switched to a system using Microsoft Word, for each month I have have a document which looks like the one below:

I can type things in, hyperlink to other documents and cut and paste graphs and pictures as well. I use the Document Map view and, by applying appropriate styling, I get quick links to each day with a view of the keywords for the day – in this instance, designing the Death Star in AutoCAD ;-) For each year I get 12 documents which I store in a folder for that year. The thing I haven’t got working in this system is nice keyword searching across multiple years.

I’ve worked on multiple projects throughout my career and I’ve come to the conclusion that trying to separate them for the purposes of lab books and references doesn’t work too well – you end up spending time working out which lab book / file you should be adding stuff to and with decent indexing it just isn’t necessary.

These days you can buy specialised electronic lab book software, it seems it is normally done at a large scale though rather than by individual which I can’t help thinking is not a good thing since we all have individual ways of working which will vary with both the work we do and our own personal ways of doing things.

Looking at my current electronic lab book it strikes me that WordPress could be used for the task. The thing that Word can’t do easily is to give me rapid links by category or date to any part of my labbook but it strikes me that WordPress does this pretty well if you put the appropriate widgets into the sidebar. I suspect any electronic lab book software is essentially a database with a front end, for WordPress the front-end is written in PHP. The benefit of WordPress is that it’s very widely used, with lots of plugins to provide new functionality and extending it is within the reach of most programmers.

Here endeth the world’s dullest blog post, comments on your own “ways of working” are most welcome!

*Except if you’re in a corporate environment, in which case the laws of every decreasing disk space cost seem to work differently.

Medical ultrasound imaging

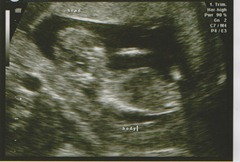
Scan1Alert readers will remember that I am in the process of becoming a father, and that the occasion of this announcement was the "dating scan" (Codename Beetle). In the UK, at least, this is an ultrasound scan targeted to take place at about 12 weeks pregnancy with a view to getting a more precise estimate of birth date from the size of the fetus, measured from “crown” to “rump”. Alongside this a nuchal fold measurement may be made to help test for Down’s Syndrome, it turns out this requires a cooperative fetus willing to assume just the right posture, Beetle wasn’t!

From a scientific point of view this is all really interesting: you can see inside people! In this instance, my wife.

The inside of a human is largely squidgy but different parts have different squidginess, in particular there is a nice contrast between the muscular wall of the womb and the liquid contents and again between the liquid contents of the womb and the fetus. Ultrasound is reflected when there are interfaces between things of different squidginess. There’s a direct analogy between this squidginess and the “impedance” of electrical components in things like hifi equipment, and the transmission of sound waves and the transmission of radio waves.

The scan starts off with the operator squirting generous quantities of lubricant onto the wife’s belly (in a hospital environment this gives me flashbacks to the Unexpected Prostate Examination Incident). The lubricant is to give good “impedance matching” between the ultrasound scanner and the swollen belly of the wife, without it the sound bouncing off the skin surface would be all you heard.

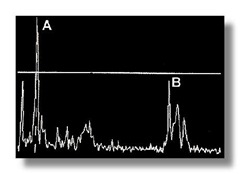
To build up an ultrasound image we listen for echoes. The ultrasound probe lets out a squeak and waits for echoes, the time taken for the echo to arrive tells you how far away the thing that created the echo. This is really obvious in the earliest ultrasound devices which worked in what is know as “A-mode”: sending out a single beam of sound in one direction and recording the sound that came back as a function of time. Typical data* shown below.

A_scan

The echo marked A represents a structure closer to the surface than the echo marked B.

You can build up a proper image by scanning your beam of sound backwards and forwards to map out a fan, this is known as “B-mode” and is the type of imaging you will be most familiar  with, the image at the top of the page is an example. It shows a vertical fan-shaped slice into the body, with features at the bottom of the scan further from the surface than those at the top.

In the old days moving the beam backwards and forwards was a mechanical process but modern scanners do it electronically with no moving parts. This is done with a “phased array” similar to those used in radar systems; a line of transmitters is fed signals with different phases (the sinusoidal sound waves are offset in time by different amounts) the result of this is a sound beam that can be steered backwards and forwards without physically moving any parts.

Kamryn Thinking Cropped_mediumThese days you can even get “4D” scans done. These use a square (2D) array of emitters to scan rapidly over an area, getting the third dimensions from the echo time and a fourth (time) dimension by being able to repeat the process rapidly. These scans are converted to a moving 3D surface (or “baby”) by thresholding the 3D data set and using computer graphics techniques to produce nice graphics. I must admit I find these images a bit creepy (the one on the right is not Beetle). Given my experience of image analysis, extracting a neat surface from the noisy data, in real time, is pretty tricky.


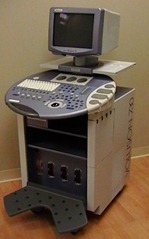
Voluson 730 Pro BT03If I’d been paying attention I could probably have read the name of the particular ultrasound scanner used on my wife, but I had other things on my mind. As it was I could identify it because there’s an interesting looking coding on the sonograph (RAB-4-8L/0B) which turns out to be the serial number of a detector for the General Electric Voluson 730 devices. A quick bit of googling reveals a convincing looking image of the scanner, they cost something in the range £20k-£40k.

Ultrasound imaging utilises sound in the frequency range 2-18MHz although for the probe used for Mrs S’s scan the range is 4-8MHz wavelengths for such waves are 0.2-0.3mm which will be the maximum achievable spatial resolution. The lowest of these ultrasound frequencies is 100 times higher than the upper limit of human hearing at 20kHz, and 10 times higher than those used by bats and dolphins.

The velocity of sound waves in water is 1540m/s, for the purposes of this calculation humans are approximately water, the raster rate (speed at which the sound beam goes backwards and forwards) appears to have been 18Hz or once every 1/18th of a second). Given the speed of sound in Mrs S, we could actually image many metres into her – if required. This suggests that the speed sound is not a limiting factor in how fast we can do scans: the noise in the signal is the limiting factor. That’s to say the strength of the echoes we get back is rather weak and looking at the images they are mixed with a lot of noise.

Ultrasound machines are really rather high technology bits of kit, containing lots of interesting physics. I must admit having read up a bit – I want one to play with!

*”Typical data”, in scientific terms means “I’m going to claim this is typical but actually this is the best we collected”.