Category: Deva Data

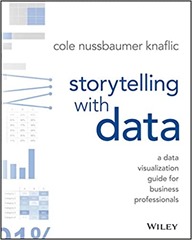
Book review: Storytelling with data by Cole Nussbaumer Knaflic

storytellingThis book, Storytelling with data by Cole Nussbaumer Knaflic, fits in with my work, and my interests. It relates to data visualisation, an area in which I have read a number of books including The Visual Display of Quantitative Information by Edward R. Tufte, Visualize This by Nathan Yau, Data Visualization: a successful design process by Andy Kirk and Interactive Data Visualization for the web by Scott Murray. These range from the intensely theoretical (Tufte) to the deeply technical (Murray).

Storytelling with data is closest in content to Andy Kirk’s book and his website is cited in the (very good) additional resources list. A second similarity with Andy Kirk’s book is that Storytelling is “the book of the course” –  the book is derived from her the author’s training courses.

The differentiating factor with Knaflic’s book is the focus on storytelling, presenting a case to persuade rather than focussing on on the production of a data visualisation, although that is part of the process. The book is divided into 6 key lessons, each of which gets a chapter, with a couple of chapters of examples, an introduction and an epilogue this makes 10 chapters. The six key lessons are:

1. understand the context
2. choose an appropriate visual display
3. eliminate clutter
4. focus attention where you want it
5. think like a designer
6. tell a story

I think I got the most out of the understand the context and tell a story chapters, technically I am quite experienced but my knowledge is around how to make charts and process the data to make charts rather than telling a story. The understanding the context chapter talks about the “Big Idea” and the “3-minutes story”. The Big Idea is the single idea you are trying to get across in a presentation, and the 3-minute story is the elevator pitch – how you would put your story into 3 minutes. I liked a callout box with a list of verbs (accept, agree, begin, believe…) used to prompt you for what action you want your audience to take having seen your presentation.

The chapter on choosing an appropriate visual display is quite straightforward, Knaflic presents the 12 types of display she finds herself using frequently (which includes simple text, and text tables). This is a fairly small set since variations of bar charts – horizontal, vertical, stacked and waterfall cover off 5 types. This is appropriate, if you are telling a story to persuade then you don’t want to be spending your time explaining how your esoteric display works. Knaflic steers away from specific technology, only mentioning at the beginning of the book that all the charts shown were made in Microsoft Excel and Adobe Illustrator was sometimes used to get a chart looking just right at the end of the process.

There is a list of sins in data visualisation including the reviled pie chart, and 3D plots but perhaps surprisingly the use of secondary axes to plot data on different scales together.

The chapters on eliminate clutter, focus attention where you want it, and think like a designer are all about making sure that the viewer is paying attention where you want them to pay attention. Some of this is about the Tuftian “eliminate clutter” much of which creeps into charts through default behaviour in software. Some is about using gestalt theories of attention to group items together through similarity, proximity and so forth and some is about using pre-attentive attributes such as colour and type face to draw attention to certain elements. This reminded me of The Programmer’s Brain by Felienne Hermans, which links theories of how our brain works with the practices of programming.

The chapter on tell a story introduces some resources on storying telling from playwrights and screenwriters – basically the idea of the three act play with a setup, conflict and resolution. This is a different way of thinking for me, my presentations tend to follow the traditional structure of a scientific paper but it is interesting to see the link with creative writing and drama – which is generally excluded from scientific writing.

One of the lessons I learnt from this book was to make better use of of chart titles and PowerPoint titles, I tend to go for  descriptive chart titles (“Ticket Trend”, to use an example from the book) and PowerPoint titles which simply labelled a section of a talk (“Methodology”). Knaflic encourages us to use this valuable “real estate” in a presentation for a call to action: “Please Approve the Hire of 2 FTEs”.

The six lessons are reinforced with a chapter which covers a single worked example from beginning to end, and another chapter of case studies which looks at fixing particular issues with single charts.

I enjoyed this book, its beautifully produced and fairly easy reading. It also led me to buy two more books Resonate by Nancy Duarte and Data Points by Nathan Yau, and so the “to be read” pile grows again!

Versioning in Python

I have recently been thinking about versioning in Python, both of Python and also of the Python packages. This is a record of how it is done for a current project and the reasoning behind it.

Python Versioning

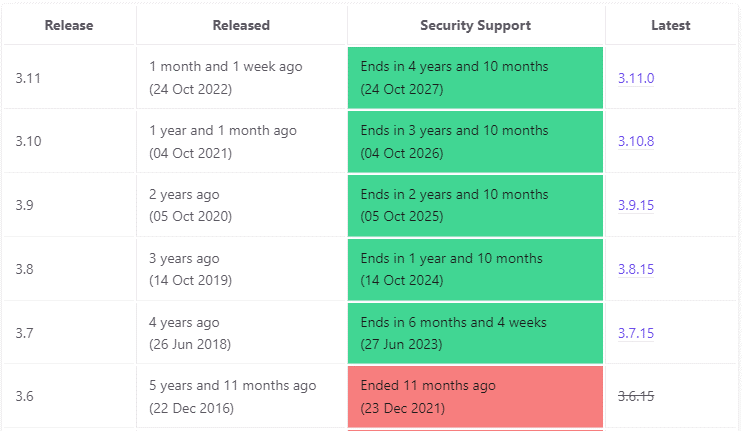
At the beginning of the project we made a conscious decision to use Python 3.9, however our package is also used by our Airflow code which does integration tests, and provides reference Docker images based on Python 3.7 (their strategy is to use the oldest version of Python still in support). This approach is documented here. And the end of life dates for recent Python versions are listed here:

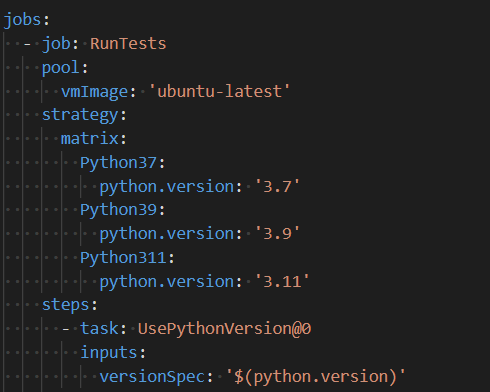
Since we started the project, Python 3.11 has been released so it makes sense to extend our testing from just Python 3.9 to include Python 3.7 and 3.11 too.

The project uses an Azure Pipeline to run continuous integration / continuous development tests, it is easy to add tests for multiple versions of Python using the following stanza in the configuration file for the pipeline.

Extending testing resulted in only a small number of minor issues, typically around Python version support for dependencies which were easily addressed by allowing more flexible versions in Python’s requirements.txt rather than pinning to a specific version. We needed to address one failing test where it appears Python 3.11 handles escaping of characters in Windows-like path strings differently from Python 3.9.

Package Versioning

Our project publishes a package to a private PyPi repository. This process fails if we attempt to publish the same version of the package twice, where the version is that specified in the “pyproject.toml”* configuration file rather than the state of the code.

Python has views on package version numbering which are described in PEP-440, this describes permitted formats. It is flexible enough to allow both Calendar Versioning (CalVer – https://calver.org/) or Semantic Versioning (SemVer – https://semver.org/) but does not prescribe how the versioning process should be managed or which of these schemes should be used.

I settled on Calendar Versioning with the format YYYY.MM.Micro. This is a considered personal taste. I like to know at a glance how old a package is, and I worry about spending time working out whether I need to bump major, minor or patch parts of a semantic version number whilst with Calendar Versioning I just need to look at the date! I use .Micro rather than .DD (meaning Day) because the day to be used is ambiguous in my mind i.e. is the day when we open a pull request to make a release or when it is merged?

It is possible to automate the versioning numbering process using a package such as bumpversion but this is complicated when working in a CI/CD environment since it requires the pipeline to make a git commit to update the version.

My approach is to use a pull request template to prompt me to update the version in pyproject.toml since this where I have stored version information to date, as noted below I moved project metadata from setup.cfg to pyproject.toml as recommended by PEP-621 during the writing of this blog post. The package version can be obtained programmatically using the importlib.metadata.version method introduced in Python 3.8. In the past projects defined __version__ programmatically but this is optional and is likely to fall out of favour since the version defined in setup.cfg/pyproject.toml is compulsory.

Should you wish to use Semantic Versioning then there are libraries that can help with this, as long as you following commit format conventions such as those promoted by the Angular project.

Once again I am struck on how this type of activity is a moving target – PEP-621 was only adopted in November 2020.

* Actually when this blog post was started version information and other project metadata were stored in setup.cfg but PEP-621 recommends it is put in pyproject.toml and is preferred by the packaging library. Setuptools has parallel instructions for using pyproject.toml or setup.cfg, although some elements to do with package and data discovery are in beta.

Software Engineering for Data Scientists

For a long time I have worked as a data scientist, and before that a physical scientist – writing code to do data processing and analysis. I have done some work in software engineering teams but only in a relatively peripheral fashion – as a pair programmer to proper developers. As a result I have picked up some software engineering skills – in particular unit testing and source control. This year, for the first time, I have worked as a software engineer in a team. I thought it was worth recording the new skills and ways of working I have picked up in the process. It is worth pointing out that this was a very small team with only three developers working about 1.5 FTE.

This blog assumes some knowledge of Python and source control systems such as git.

Coding standards

At the start of the project I did some explicit work on Python project structure, which resulted in this blog post (my most read by a large margin). At this point we also discussed which Python version would be our standard, and which linters (syntax/code style enforcers) we would use (Black, flake and pylint) – previously I had not used any linters/syntax checkers other than those built-in to my preferred editors (Visual Studio Code). My Python project layout used to be a result of rote learning – working in a team forced me to clarify my thinking in this area.

Agile development

We followed an Agile development process, with work specified in JIRA tickets which were refined and executed in 2 week sprints. Team members were subjected to regular rants (from me) on the non-numerical “story points” which have the appearance of numbers BUT REALLY THEY ARE NOT! Also the metaphor of sprinting all the time is exhausting. That said I quite like the structure of working against tickets and moving them around the JIRA board. Agile development is the subject of endless books, I am not going to attempt to describe it in any detail here.

Source control and pull requests

To date my use of source control (mainly git these days) has been primitive; effectively I worked on a single branch to which I committed all of my code. I was fairly good at committing regularly, and my commit messages were reasonable useful. I used source control to delete code with confidence and as a record of what I was doing when.

This project was different – as is common we operated on the basis of developing new features on branches which were merged to the main branch by a process of “pull requests” (GitHub language) / “merge requests” (GitLab language). For code to be merged it needed to pass automated tests (described below) and review by another developer.

I now realise we were using the GitHub Flow strategy (a description of source control branching strategies is here) which is relatively simple, and fits our requirements. It would probably have been useful to talk more explicitly about our strategy here since I had had no previous experience in this way of working.

I struggled a bit with the code review element, my early pull requests were massive and took ages for the team to review (partly because they were massive, and partly because the team was small and had limited time for the project). At one point I Googled for dealing with slow code review and read articles starting “If it takes more than a few hours for code to be reviewed….” – mine were taking a couple of weeks! My colleagues had a very hard line on comments in code (they absolutely did not want any comments in code!)

On the plus side I learnt a lot from having my code reviewed – often in pushing me to do stuff I knew I should have done. I also learned from reviewing other’s code, often I would review someone else’s code and then go change my own code.

Automated pipelines

As part of our development process we used Azure Pipelines to run tests on pull requests. Azure is our corporate preference – very similar pipeline systems can be found in GitHub and GitLab. This was all new to me in practical, if not theoretical, terms.

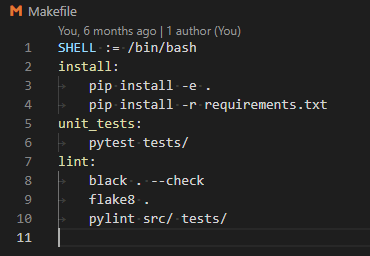
Technically configuring the pipeline involved a couple of components. The first is optional, we used Linux “make” targets to specify actions such as running installation, linters, unit tests and integration tests. Make targets are specified in a Makefile, and are involved with simple commands like “make install”. I had a simple MakeFile which looked something like this:

The make targets can be run locally as well as in the pipeline. In practice we could fix all issues raised by black and flake8 linters but pylint produced a huge list of issues which we considered then ignored (so we forced a pass for pylint in the pipeline).

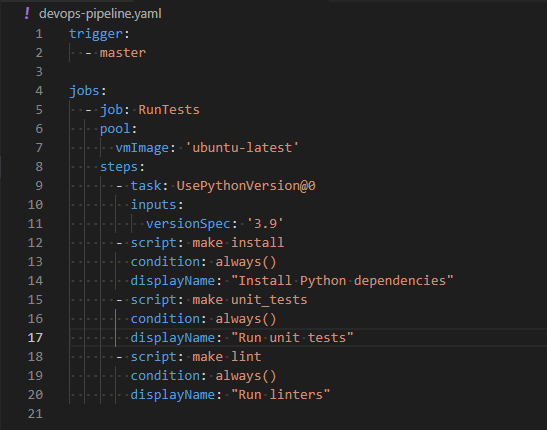
The Azure Pipeline was defined using a YAML file, this is a simple example:

This YAML specifies that the pipeline will be triggered on attempting a pull request against a main branch. The pipeline is run on an Ubuntu image (the latest one) with Python 3.9 installed. Three actions are done, first installation of the Python package specified in the git repo, then unit tests are run and finally a set of linters is run. Each of these actions is run regardless of the status of previous actions. Azure Pipelines offers a lot of pre-built tasks but they are not portable to other providers, hence the use of make targets.

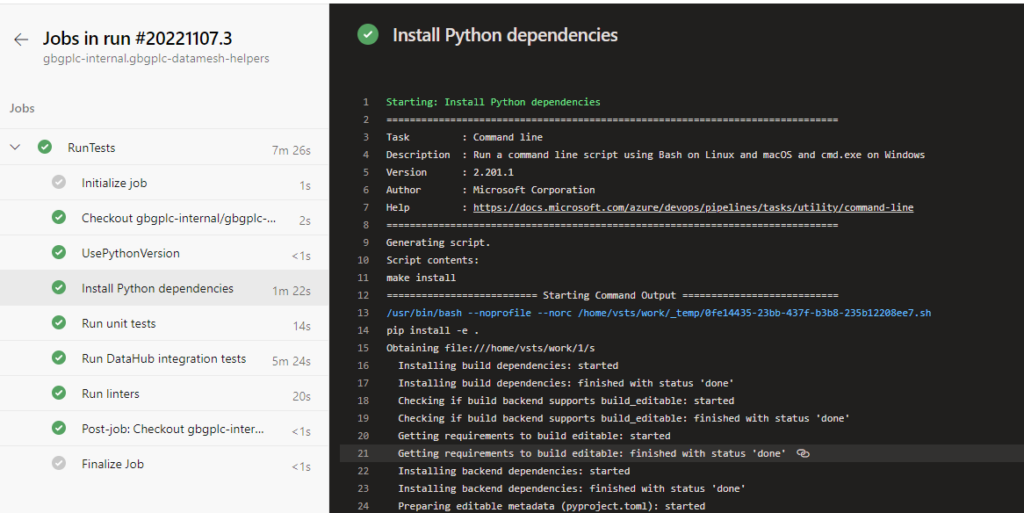
The pipeline is configured by navigating to the Azure Pipeline interface and pointing at the GitHub repo (and specifically this YAML file). The pipeline is triggered when a new commit is pushed to the branch on GitHub. The results of these actions are shown in a pretty interface with extensive logging.

The only downside of using a pipeline from my point of view was that my standard local operating environment is Windows with the git-bash prompt providing a Linux-like commandline interface. The pipeline was run on an Ubuntu image, which meant that certain tests would pass locally, but not in the pipeline, and were consequently quite difficult to debug. Regular issues were around checking file sizes (line endings mean that file sizes on Linux and Windows differ) and file paths – even with Python’s pathlib – are different between Windows and Linux systems. Using a pipeline forces you to ensure your installation process is solid, since the pipeline image is built on every run.

We also have a separate pipeline to publish the Python package to a private PyPi repository but that is the subject of another blog post.

Conclusions

I learnt a lot working with other, more experienced, software engineers and as a measure of the usefulness of this experience I have retro-fitted the standard project structure and make targets to my legacy projects. I have started using pipelines for other applications.

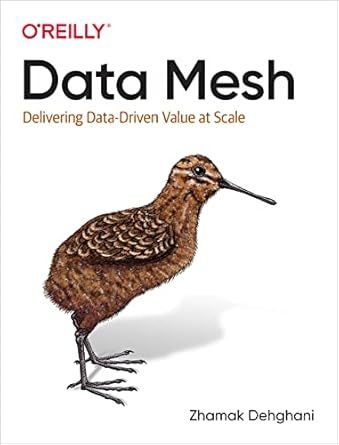
Book review: Data mesh by Zhamak Dehgani

This book, Data mesh: Delivering Data-Driven Value at Scale by Zhamak Dehghani essentially covers what I have been working on for the last 6 months or so, therefore it is highly relevant but I perhaps have to be slightly cautious in what I write because of commercial confidentiality.

The Data Mesh is a new design for handling data within an organisation, it has been developed over the last 3 or 4 years with Dehghani at the Thoughtworks consultancy at the core. Given its recency there are no Data Mesh products on the market so one is left build your own on the basis of components available.

To a large degree the data mesh is a conceptual and organisational shift rather than a technical shift, all the technical component parts are available for a data mesh, less programmatic glue to hold the whole thing together.

Data Mesh the book is divided into five parts, the first describes what a data mesh is in fairly abstract terms, the second explains why one might need a data mesh, the third and fourth parts about how to design the architecture of the data mesh itself, and the data products that make it up. The final part is on “How to get started” – how to make it happen in your organisation.

Dehghani talks in terms of companies having established systems for operational data (data required to serve customers and keep the business running such billing information and the state of bank accounts), the data mesh is directed at analytical data – data which is derived from the operational data.  She uses a fictional company, Daff, Inc. that sounds an awful lot like Spotify to illustrate these points. Analytical data is used to drive machine learning recommender systems, for example, and better understanding of business, customer and operations.

The legacy data systems Data Mesh describes are data warehouses and data lakes where data is managed by a central team. The core issue this system brings is one of scalability, as the number of data sets grows the size of the central team grows, and the responsiveness of the system drops.

The data mesh is a distributed solution to this centralised system. Dehghani defines the data mesh in terms of four principles, listed in order of importance:

  1. Domain Ownership – this says that analytical data is owned by the domains that generate it rather than a centralised data team;
  2. Data as a product – analytical data is owned as a product, with the associated management, discoverability, quality standards and so forth around it. Data products are self-contained entities in their own right – in theory you can stand up the infrastructure to deliver a single data product all by itself;
  3. Self-serve data platform – a self-serve data platform is introduced which makes the process of domain ownership of data products easier, delivering the self-contained infrastructure and services that the data product defines;
  4. Federated computational governance – this is the idea that policies such as access control, data retention, encryption requirements, and actions such as the “right to be forgotten” are determined centrally by a governance board but are stored, and executed, in machine-readable form by data products;

For me the core idea is that of a swarm of self-contained data products which are all independent but by virtue of simple behaviours and some mesh spanning services (such as a data catalogue) provide a sum that is greater than the whole. A parallel is drawn here with domain-driven design and microservices, on which the data mesh is modelled.

I found the parts on designing the data mesh platform and data products most interesting since this is the point I am at in my work. Dehghani breaks the data mesh down into three “planes”: the infrastructure utility plane, the data product experience plane, and the mesh experience plane (this is where the data catalogue lives).

We spent some time worrying over whether it was appropriate to include data processing functionality in our data mesh – Dehghani makes it clear that this functionality is in scope, arguing that the benefit of the data product orientation is that only a small number data pipelines are managed together rather than hundreds or possibly thousands in a centralised scheme.

I have been spending my time writing code, which Dehghani describes as the “sidecar”, common code that sits inside the data product to provide standard functionality. In terms of useful new ideas, I have been worrying about versioning of data schema and attributes – Dehghani proposes that “bitemporality” is what is required here (see Martin Fowler’s blog post here for an explanation). Essentially bitemporality means recording the time at which schema and attributes were changed, as well as the time at which data was provided and recording the processing time. This way one can always recreate a processing step simply by checking which set of metadata and data were in play at the time (bar data being deleted by a data retention policy).

Data Mesh also encouraged me to decouple my data catalogue from my data processing, so that a data product can act in a self-contained way without depending on the data catalogue which serves the whole mesh and allows data to be discovered and understood.

Overall, Data Mesh was a good read for me in large part because of its relevance to my current work but it is also well-written and presented. The lack of mention of specific technologies is rather refreshing and means the book will not go out of date within the next year or so. The first companies are still only a short distance into their data mesh journeys, so no doubt a book written in five years time will be a different one but I am trying to solve a problem now!

A way of working: data science

I am about to take on a couple of data science students from Lancaster University for summer projects, from past experience I always spend some time at the beginning of such projects explaining how I work with the expectation that they will at least take some notice if not repeat my methodology exactly. This methodology evolves slowly over time as I learn new things and my favoured technologies change.

Typically I develop on a Windows laptop but I use the git-bash prompt as my shell for typing in commands – this is a Linux-like terminal which I adopted after working with developers who mainly used Linux and also because I was familiar with the Unix style commandline from before the time on Linux. You can do a lot from the commandline in data science – Data Science at the Command Line by Jeroen Janssens is an excellent introduction.

I use Docker containers a bit to spin up local versions of services which are difficult to run on Windows (things like Airflow and Linkedin DataHub), some people develop entirely inside Docker containers to reduce dependency issues and make deployment of code easier.

I work pretty much entirely in Python for data processing and analysis although I generate CSV files which I load to Tableau for visualisation. I tend not to try complex processing in Tableau since I find the GUI inconvenient and confusing for such work. I use the Anaconda distribution of Python, originally because I liked that it came packaged with a load of useful libraries for data science and it handled virtual environments and installation of more tricky packages better than plain Python. It may be worth revisiting this decision. I have recently shifted my code to Python 3.9.

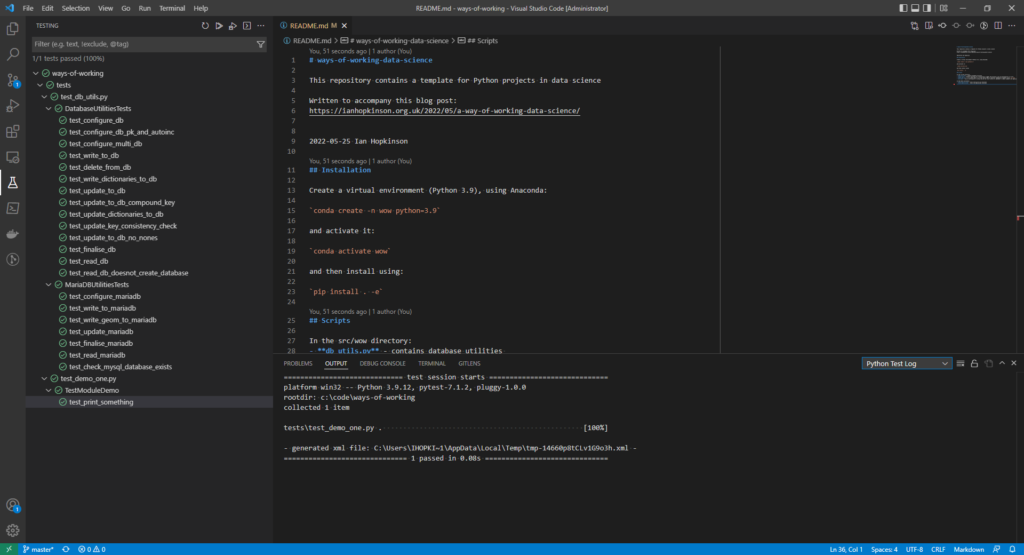
For a piece of work I will usually set up a Python project which can be “installed”. This blog post explains a standard structure for Python projects. I aim to use Python virtual environments on a per project basis but sometimes I fail. Typically, I will write Python modules that provide functions but also have a simple command line interface which takes two or three positional parameters. You can see this in action in the git repo here which I share as a template for myself and others!

To date I have picked up commandline arguments using sys.argv I should probably use one of the libraries to make these commandline interfaces better, there is a blog post here which compares the built-in argparse library with click and docopt. I think I might check out click for future projects.

As well as running commandline scripts I use tests to develop analysis, as well as being good software development practice, test runners make a convenient way to run arbitrary functions in a code base. I prefer to use the unittest built-in library but I’ve started using pytest for a recent project. I wrote a blog post about writing tests, since I wrote it I have learned about test mocks and pytest’s fixture functionality.

I have a library of general utilities for interacting with databases, setting up logging and writing dictionaries which I wrote because I found I was doing these things repeatedly and making my own library allowed me to forgot some of the boilerplate code required to do these things. The key utilities are included with the repo attached to this blog.

I’ve been using Visual Code as my editor for some time now, I prefer not to use full blown IDEs because I find they present more functionality than I can cope with. I think this is as a result of coding in Java using Eclipse and C# .net in Visual Studio. In any case Visual Code starts as a nice enough code editor but has been sneaking in more IDE functionality via extensions.

The extensions I use heavily in Visual Code are Python and Pylance – the Python language server provides type-hinting support. I wrote about type-hinting in Python here. I also use Rainbow CSV for when I am editing or viewing CSV files.

I could use Visual Code for accessing git, my preferred source control system, but instead I use GitKraken which has a very nice GUI interface. Since I am usually working by myself my git usage is very simple, I typically have one branch onto which I make many small commits. I have recently started working with a team where I am using feature-based branches which get merged by pull requests – this was a bit of a culture shock.

As a result of working with other people on a new project I have started using some technologies which I will just mention here. I run the black formatter, as well pylint and flake8. Black just reformats my code files when I save them and can largely be ignored. Flake8 is fairly easy to satisfy although I spent a lot of time addressing line length issues. Pylint generates quite a few warnings which I attend to but sometimes ignore.

I have also started using Make files and Azure Devops pipelines for running common tasks on my code (tests, cleanup, setting up infrastructure, linting).

Outside technology, I have a very long established method of working using a monthly Word document as a notebook, I describe it here. I tend to prefix file names with ISO8601 format dates (2022-05-22) this means that if I created a Tableau workbook or an Excel worksheet I can link it easily to what I was writing in my notebook and the status of the appropriate git repo at that point in time.

I’ve incorporated all the code related elements mentioned above in this ways-of-working-data-science git repository.