As is traditional here I present an annual review of my blog which is largely comprised of book reviews but this year includes some technical posts as I learnt some new software engineering skills.
In book terms I started the year with Natives by Akala – this is the autobiography of Akala, – it fits into the Black Lives Matter theme which I started in the previous year. Railways and the Raj by Christian Wolmar also has something of this air, the way the British ran the Raj, and the subsequent violence on Partition are a salutatory lesson.
I read a couple of books about scripts, one specifically focussed on Chinese script – Kingdom of Characters by Jing Tsu, and a second, very short book, on all scripts – Writing and script – A very Short Introduction by Andrew Robinson.
From a technical point of view I read Felienne Hermans’ The Programmer’s Brain which definitely provided a lot of food for thought, Software Design Decoded by Marian Petre and André van der Hoek and Data mesh by Zhamak Dehgani. The topic of this last book, the data mesh, has been a central theme of my work this year.
My favourite book of the year was Pale Rider – The Spanish Flu of 1918 by Laura Spinney which was written before the covid pandemic, it was interesting to see the differences – no effective vaccines, or even a clear understanding of viruses and the similarities – arguments over schools remaining open. I also read The Art of More by Michael Brooks – a history of maths, it turns out accounting and bureaucracy were important drivers in the invention of maths. The last book of the year was Dutch Light by Hugh Aldersey-Williams – a biography of Christiaan Huygens – the second I have read.
On a more general history front I read Ask a Historian by Greg Jenner and Curious devices and mighty machines by Samuel J.M.M. Alberti, which is about science museums.
I continue to learn how to play the guitar, Play it Loud by Brad Tolinski and Alan Di Perna fits in with this – it is a history of the electric guitar, broader than The Birth of Loud by Ian S. Port which I read a few years ago. I have stopped with learning to play the (electronic) drums.
My posting this year was a bit more varied than it has been for a while, I started a thread of technical posts written as I clarified my thinking for a project I am working on at work – one of which, Understanding setup.py, setup.cfg and pyproject.toml in Python, has been my most popular blog post by a large margin and boosted traffic to my blog to the highest level ever! That’s not to say traffic is particular high – I had about 20,000 visitors this year. Versioning in Python was in a similar vein – technical information about some very specific technology. A way of working: data science and Software engineering for Data Scientists were a bit more general and philosophical, they have received rather less traffic.
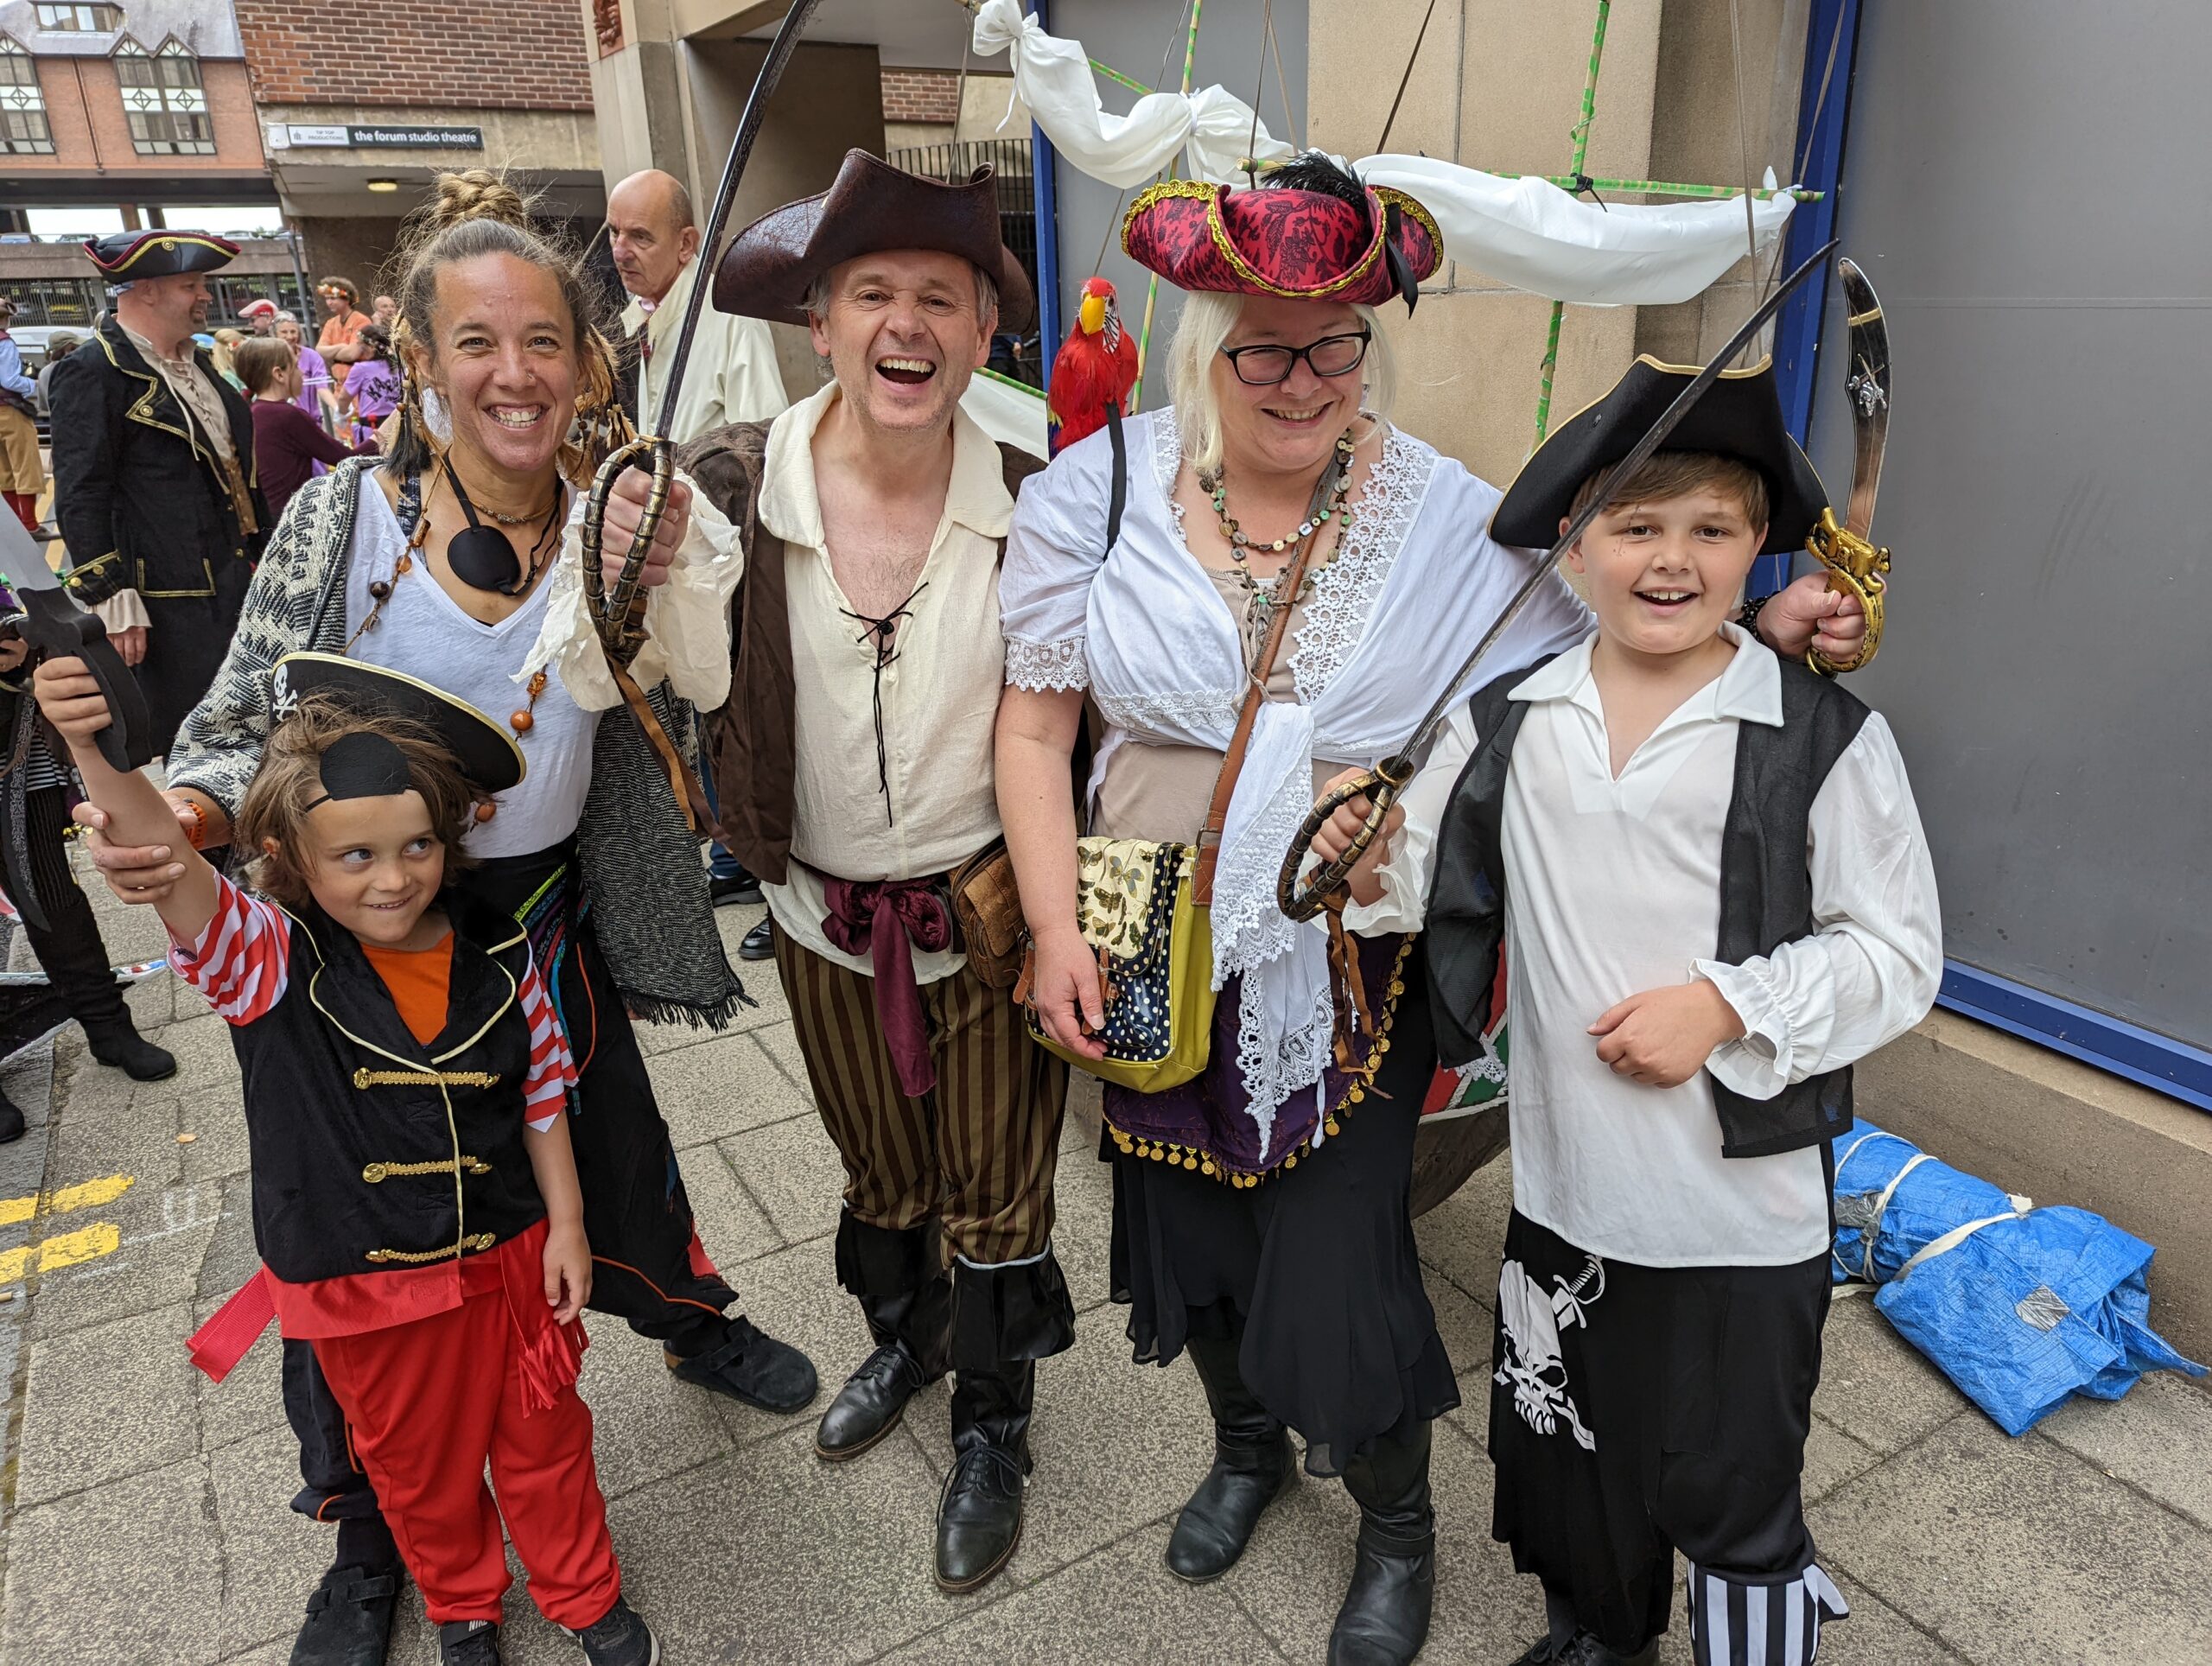
In the summer the whole family joined Chester’s mid-Summer Parade as pirates which was a great deal of fun.
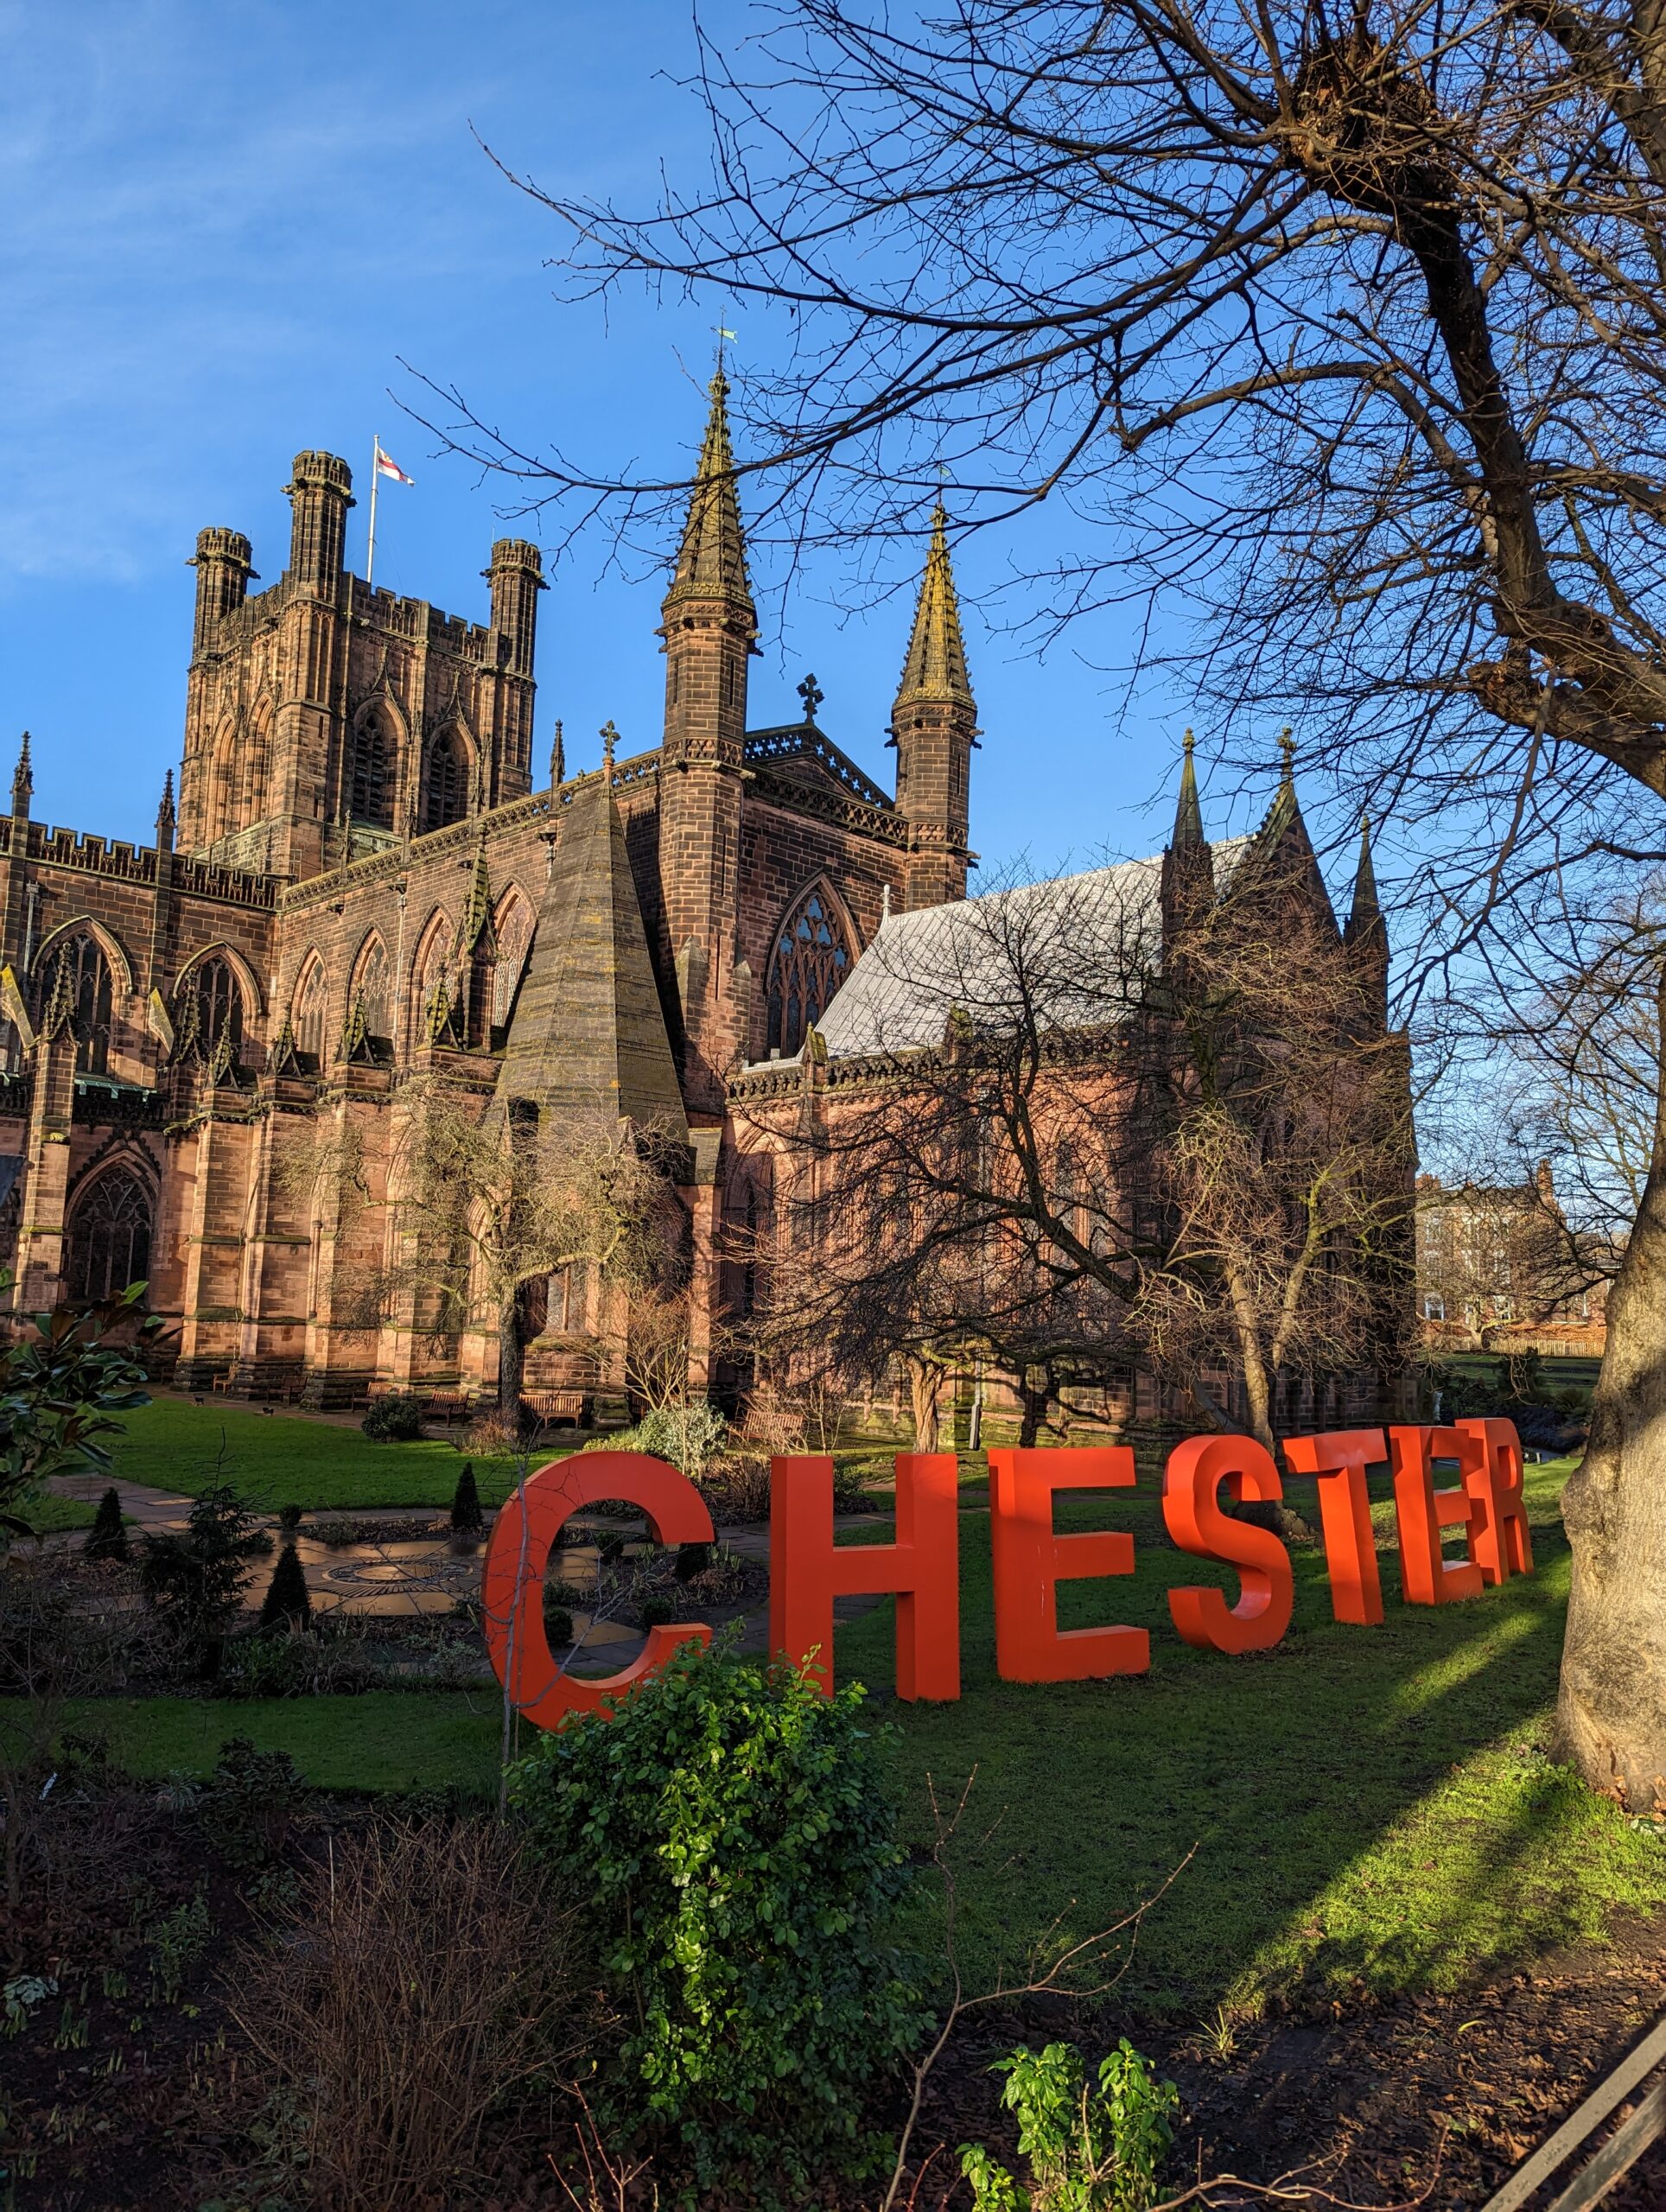
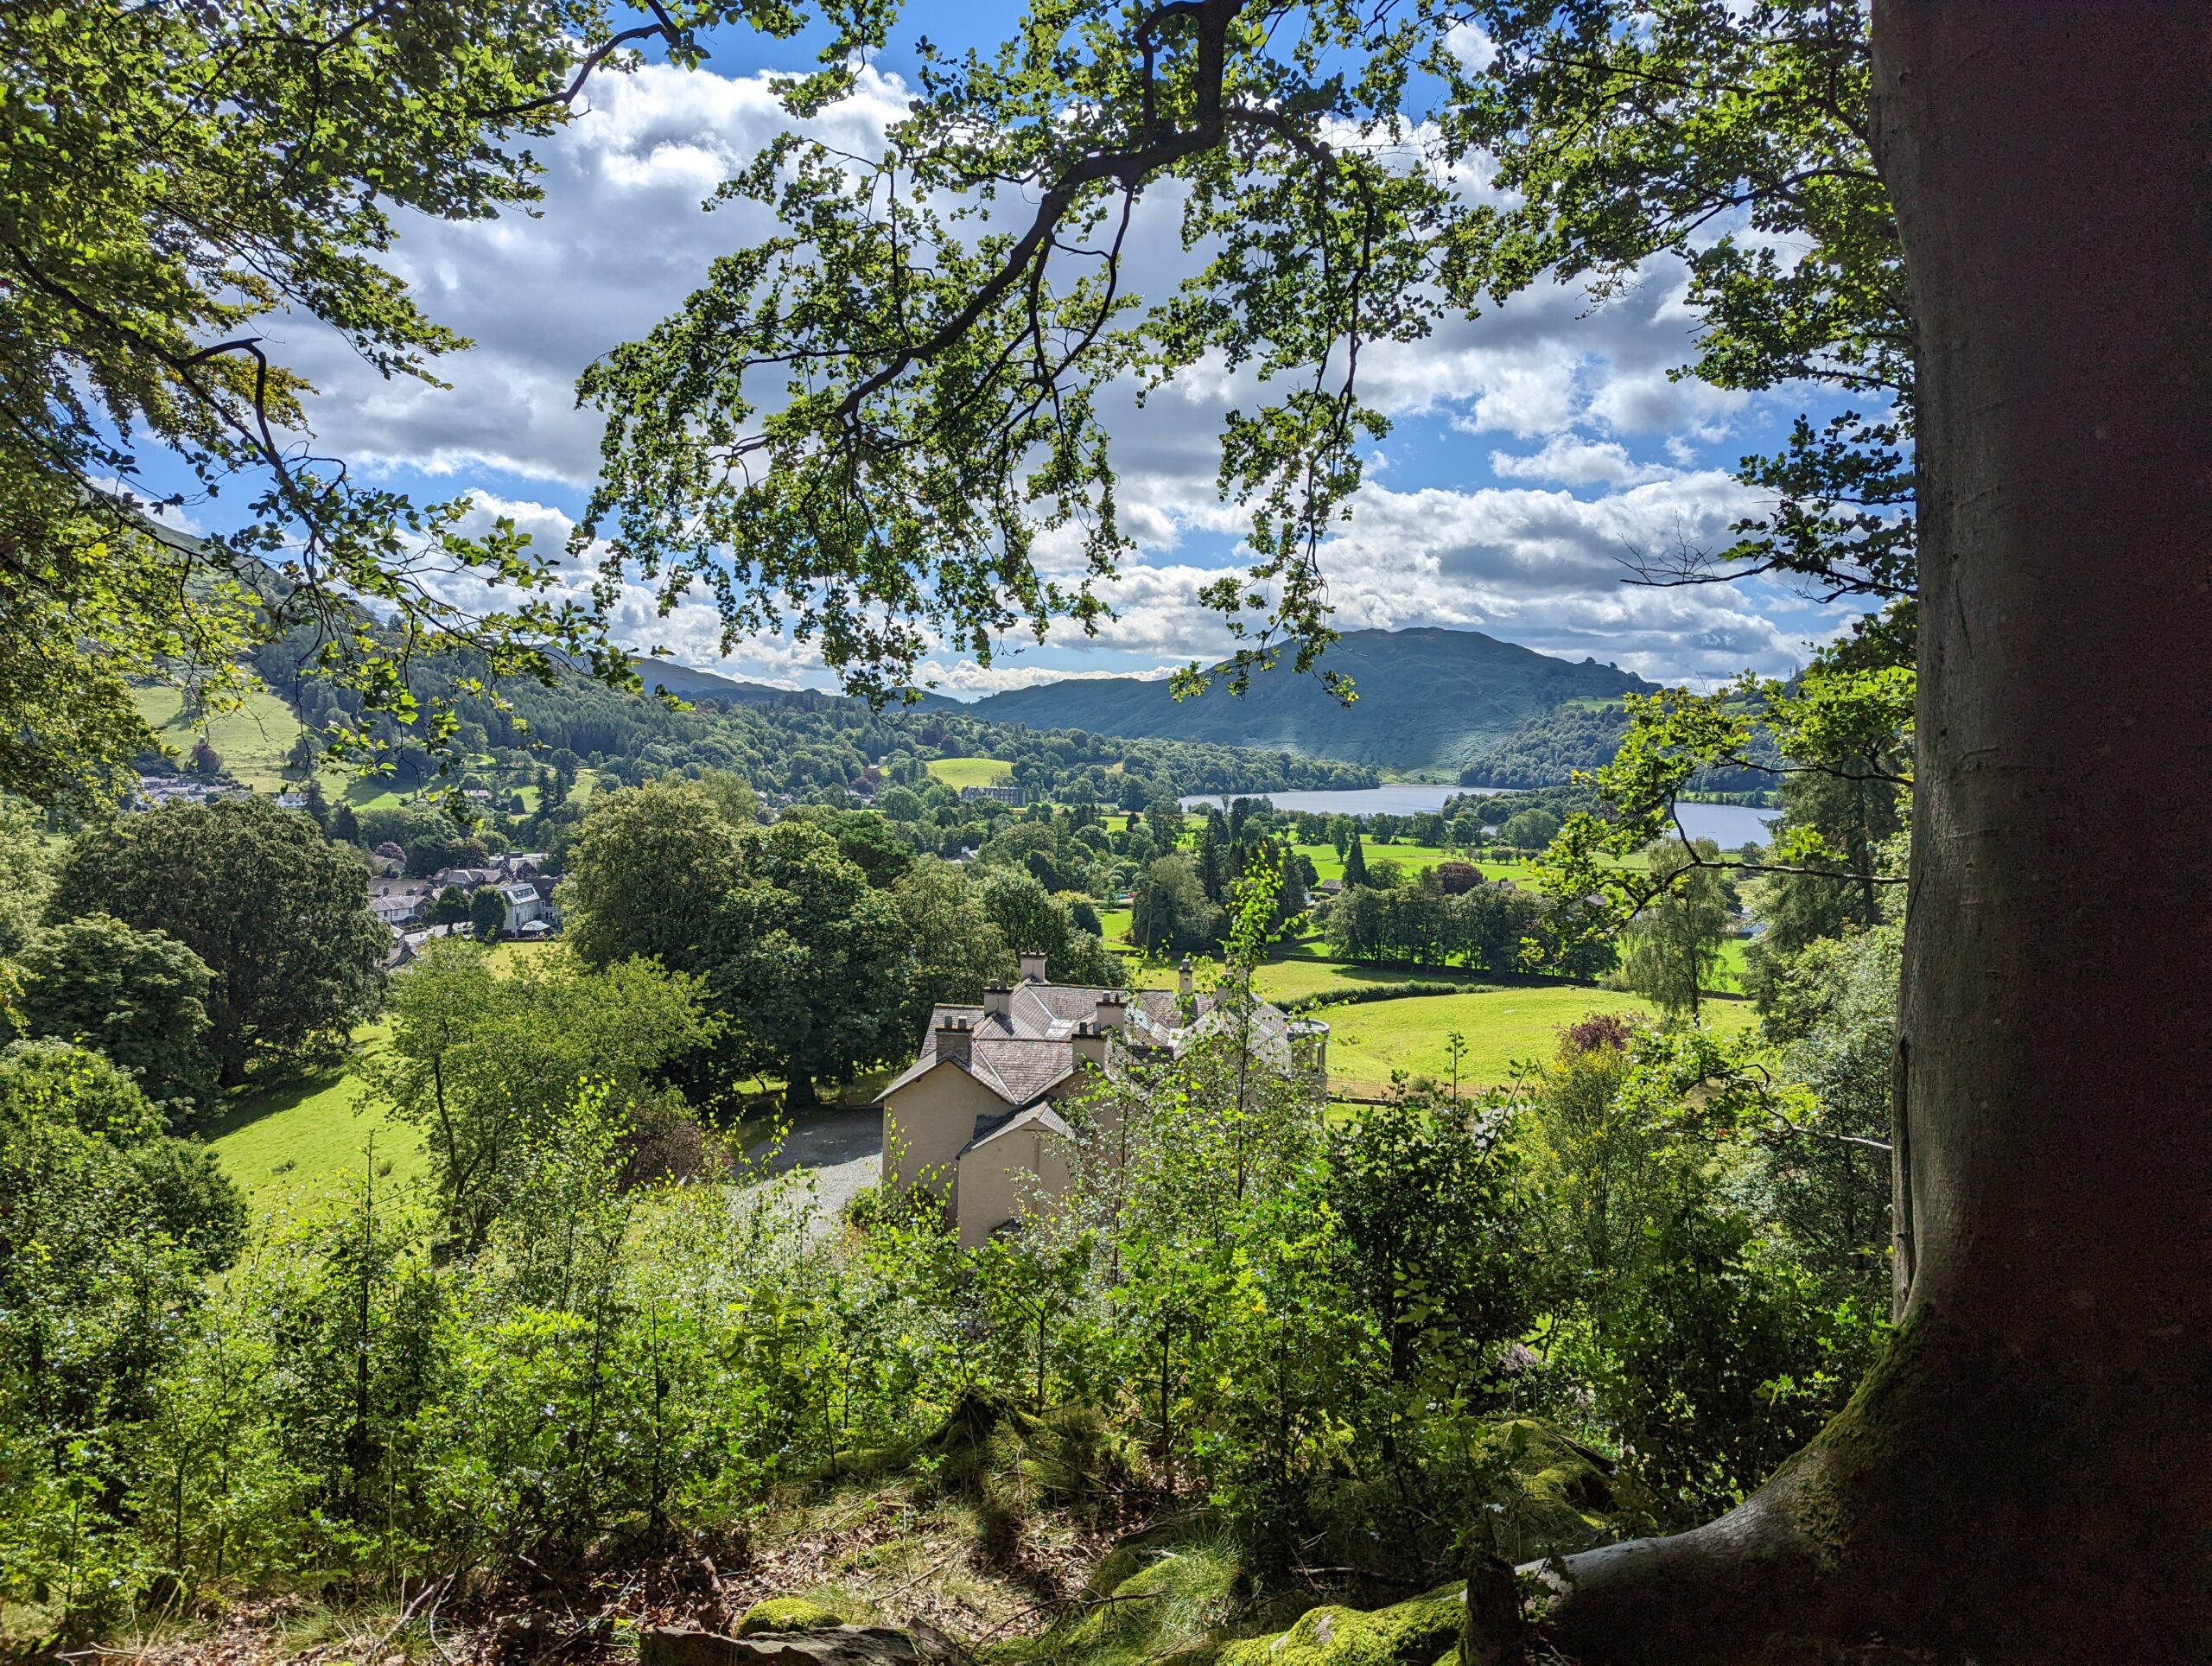
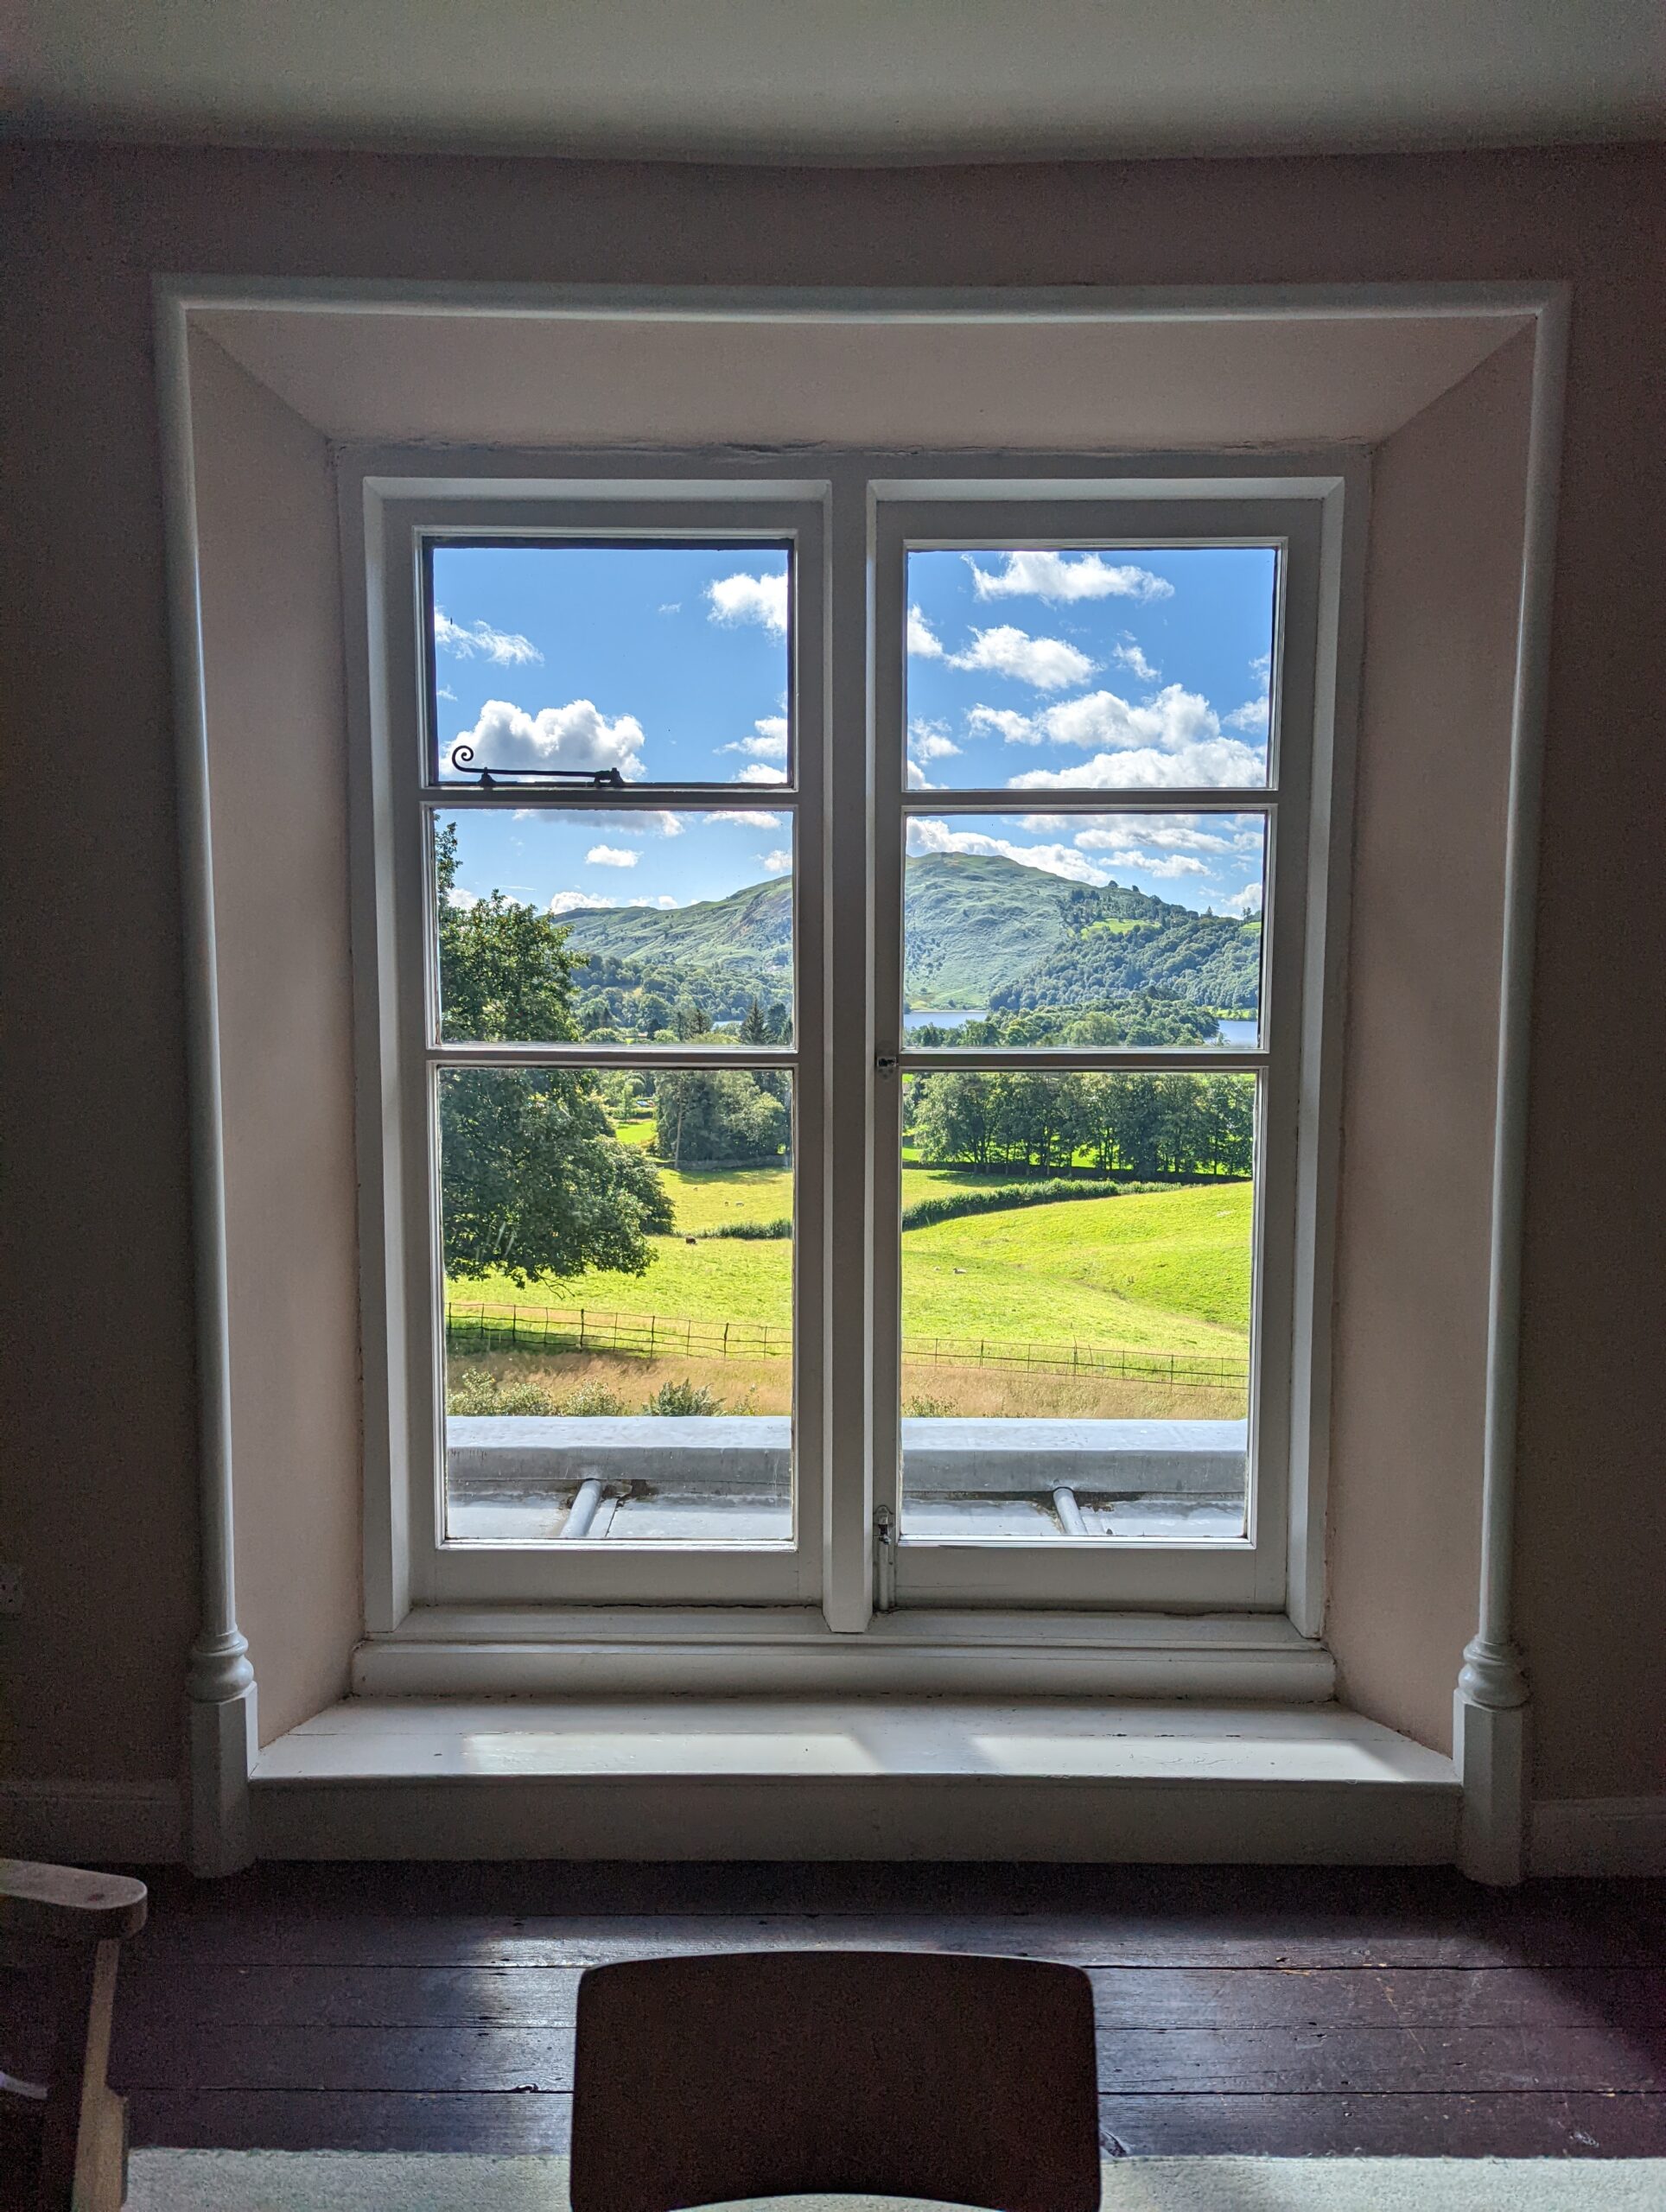
On the holiday front, we went to Ambleside in the Lake District for a week in July. The photos below are from Allan Bank by Grasmere – an exceedingly relaxed National Trust property. I was impressed by my new phone’s ability to take reasonable photos through windows – normally the inside of the room would be under-exposed, the photo album for the trip is here with many more photographs.
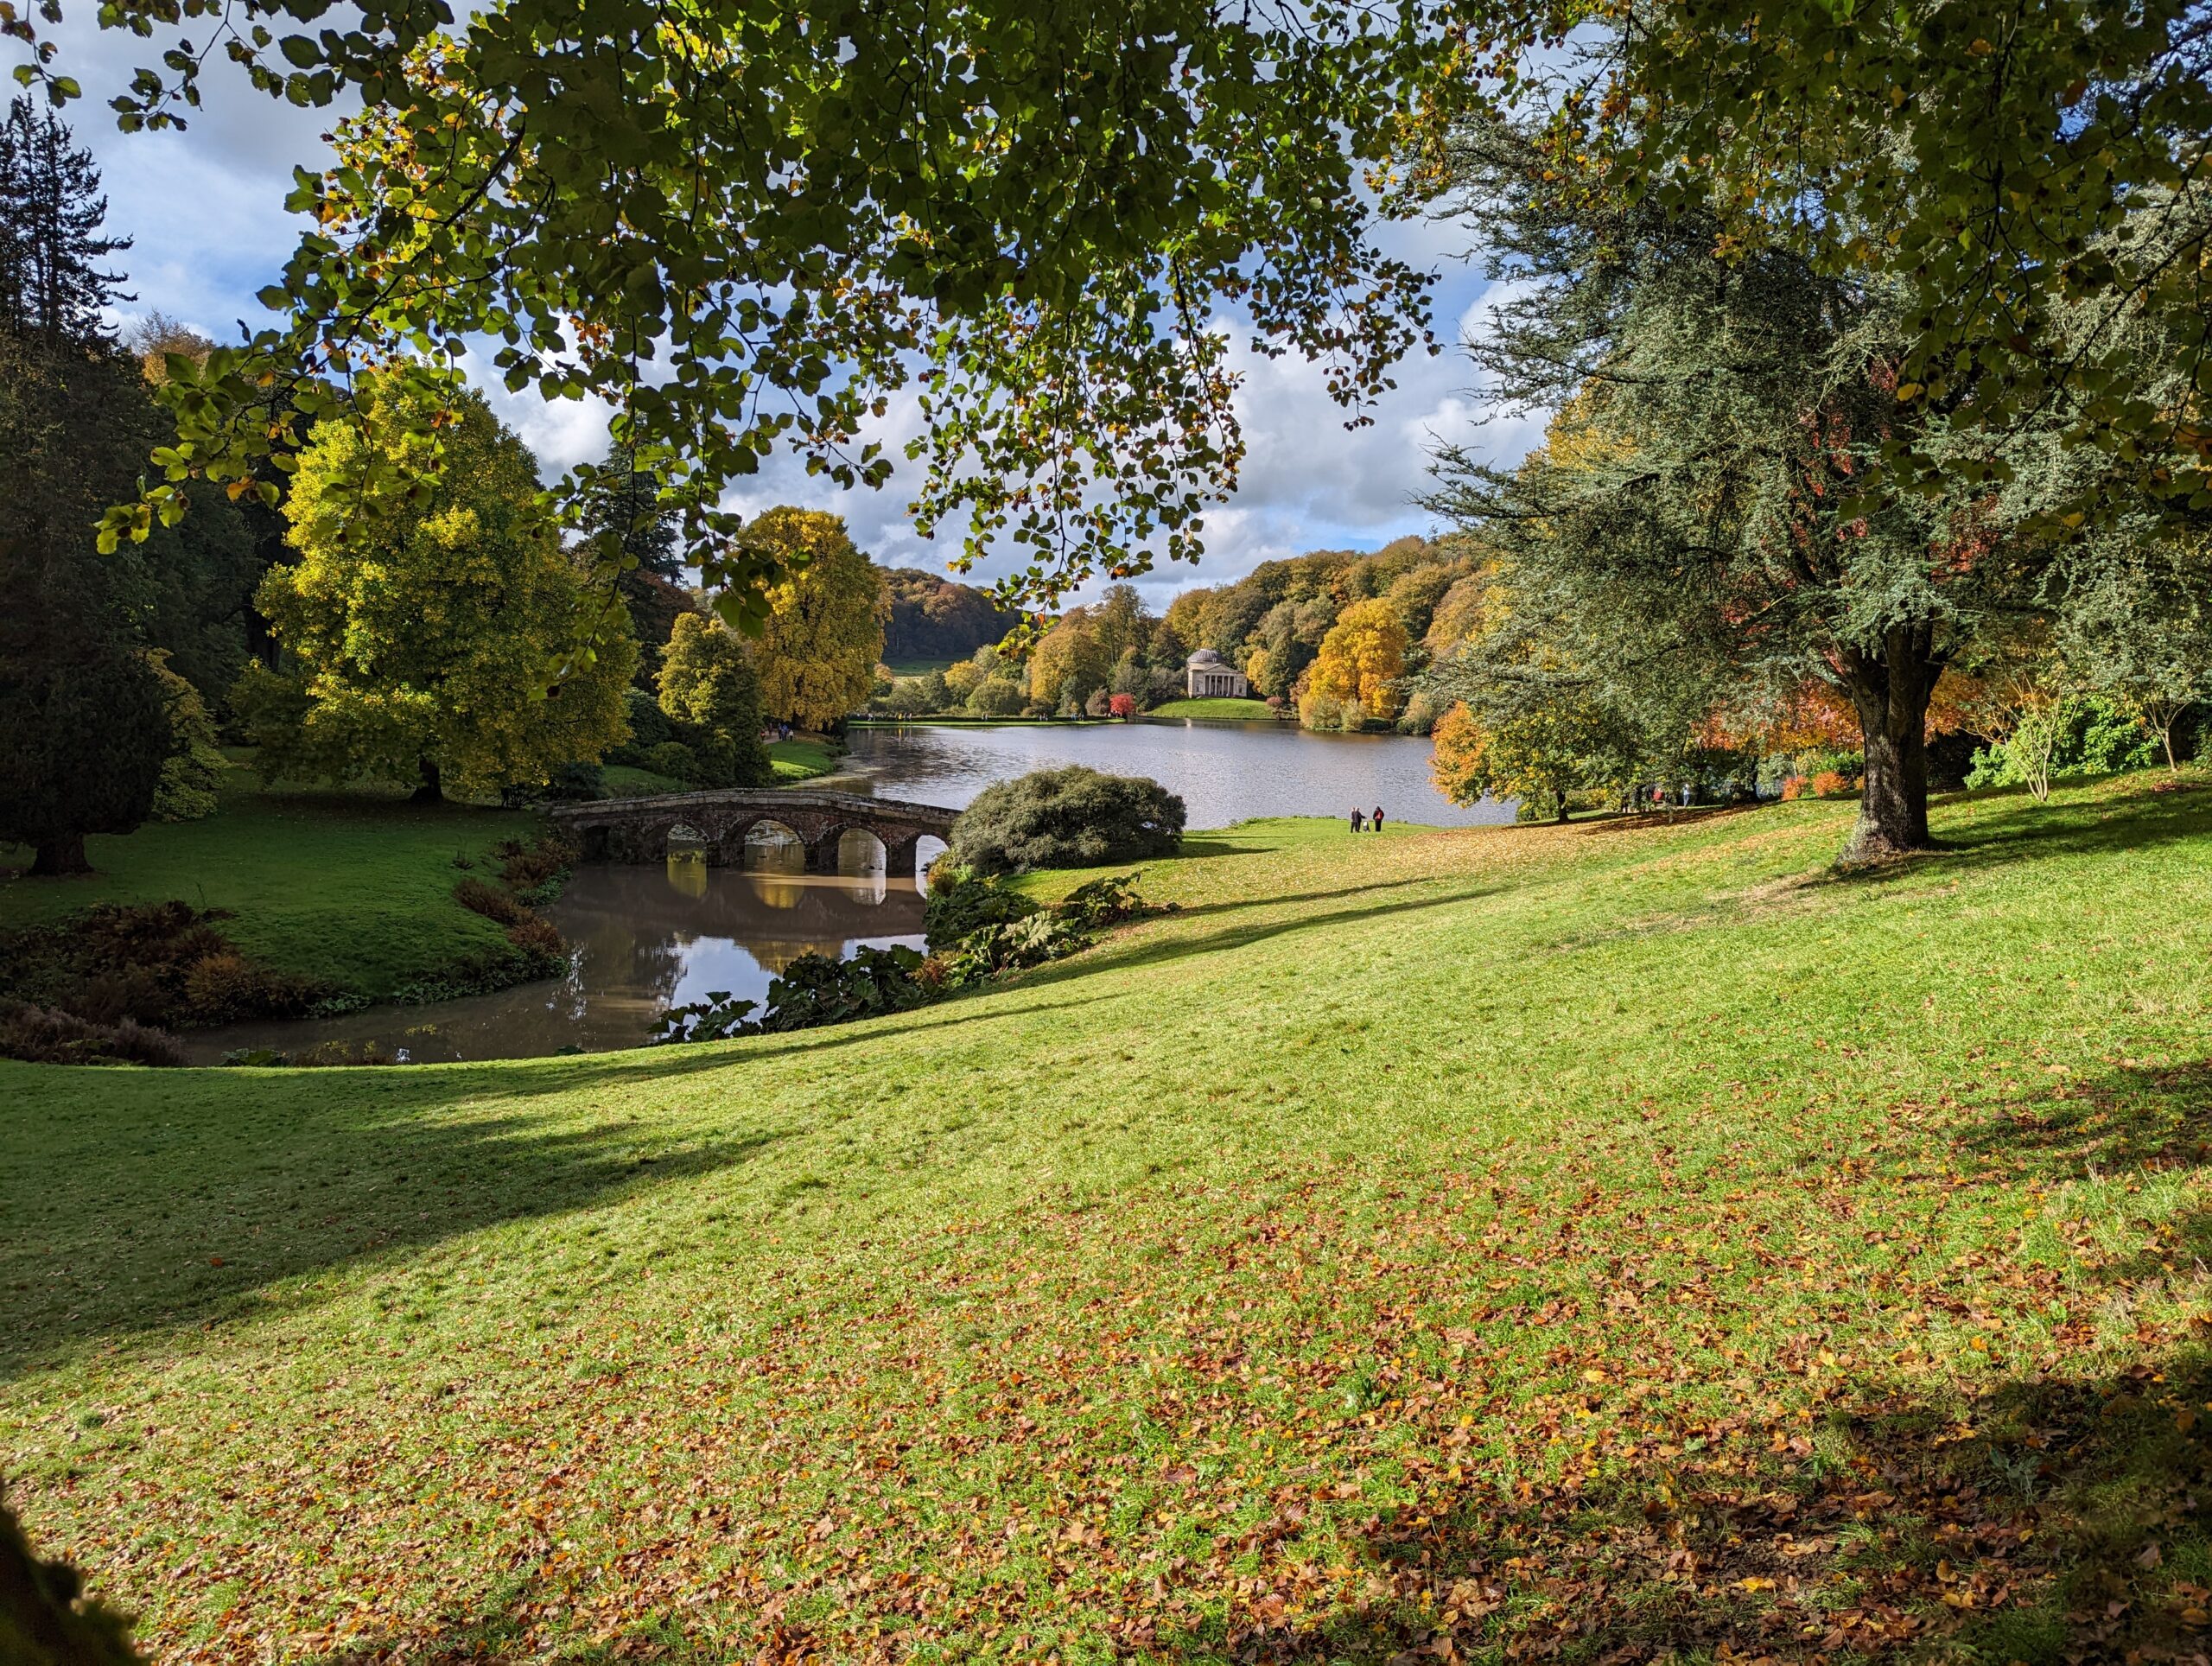
We also went to Dorset in October, where I grew up, stopping off at the gardens at Stourhead on the way down (pictured below). I scattered the ashes of my dad and stepmother with my stepbrothers in the New Forest. I was surprised how much ashes were involved – a large bag of flour-sized quantity for each of them. Dad would have been proud that two parties converged from two directions on the same location in the middle of the Forest from an X on an Ordnance Survey map, probably less impressed by me getting lost in a bog on the way back! Although as Mrs H said, getting lost having said a final farewell to my dad was rather symbolic. I posted a eulogy for my dad, here.
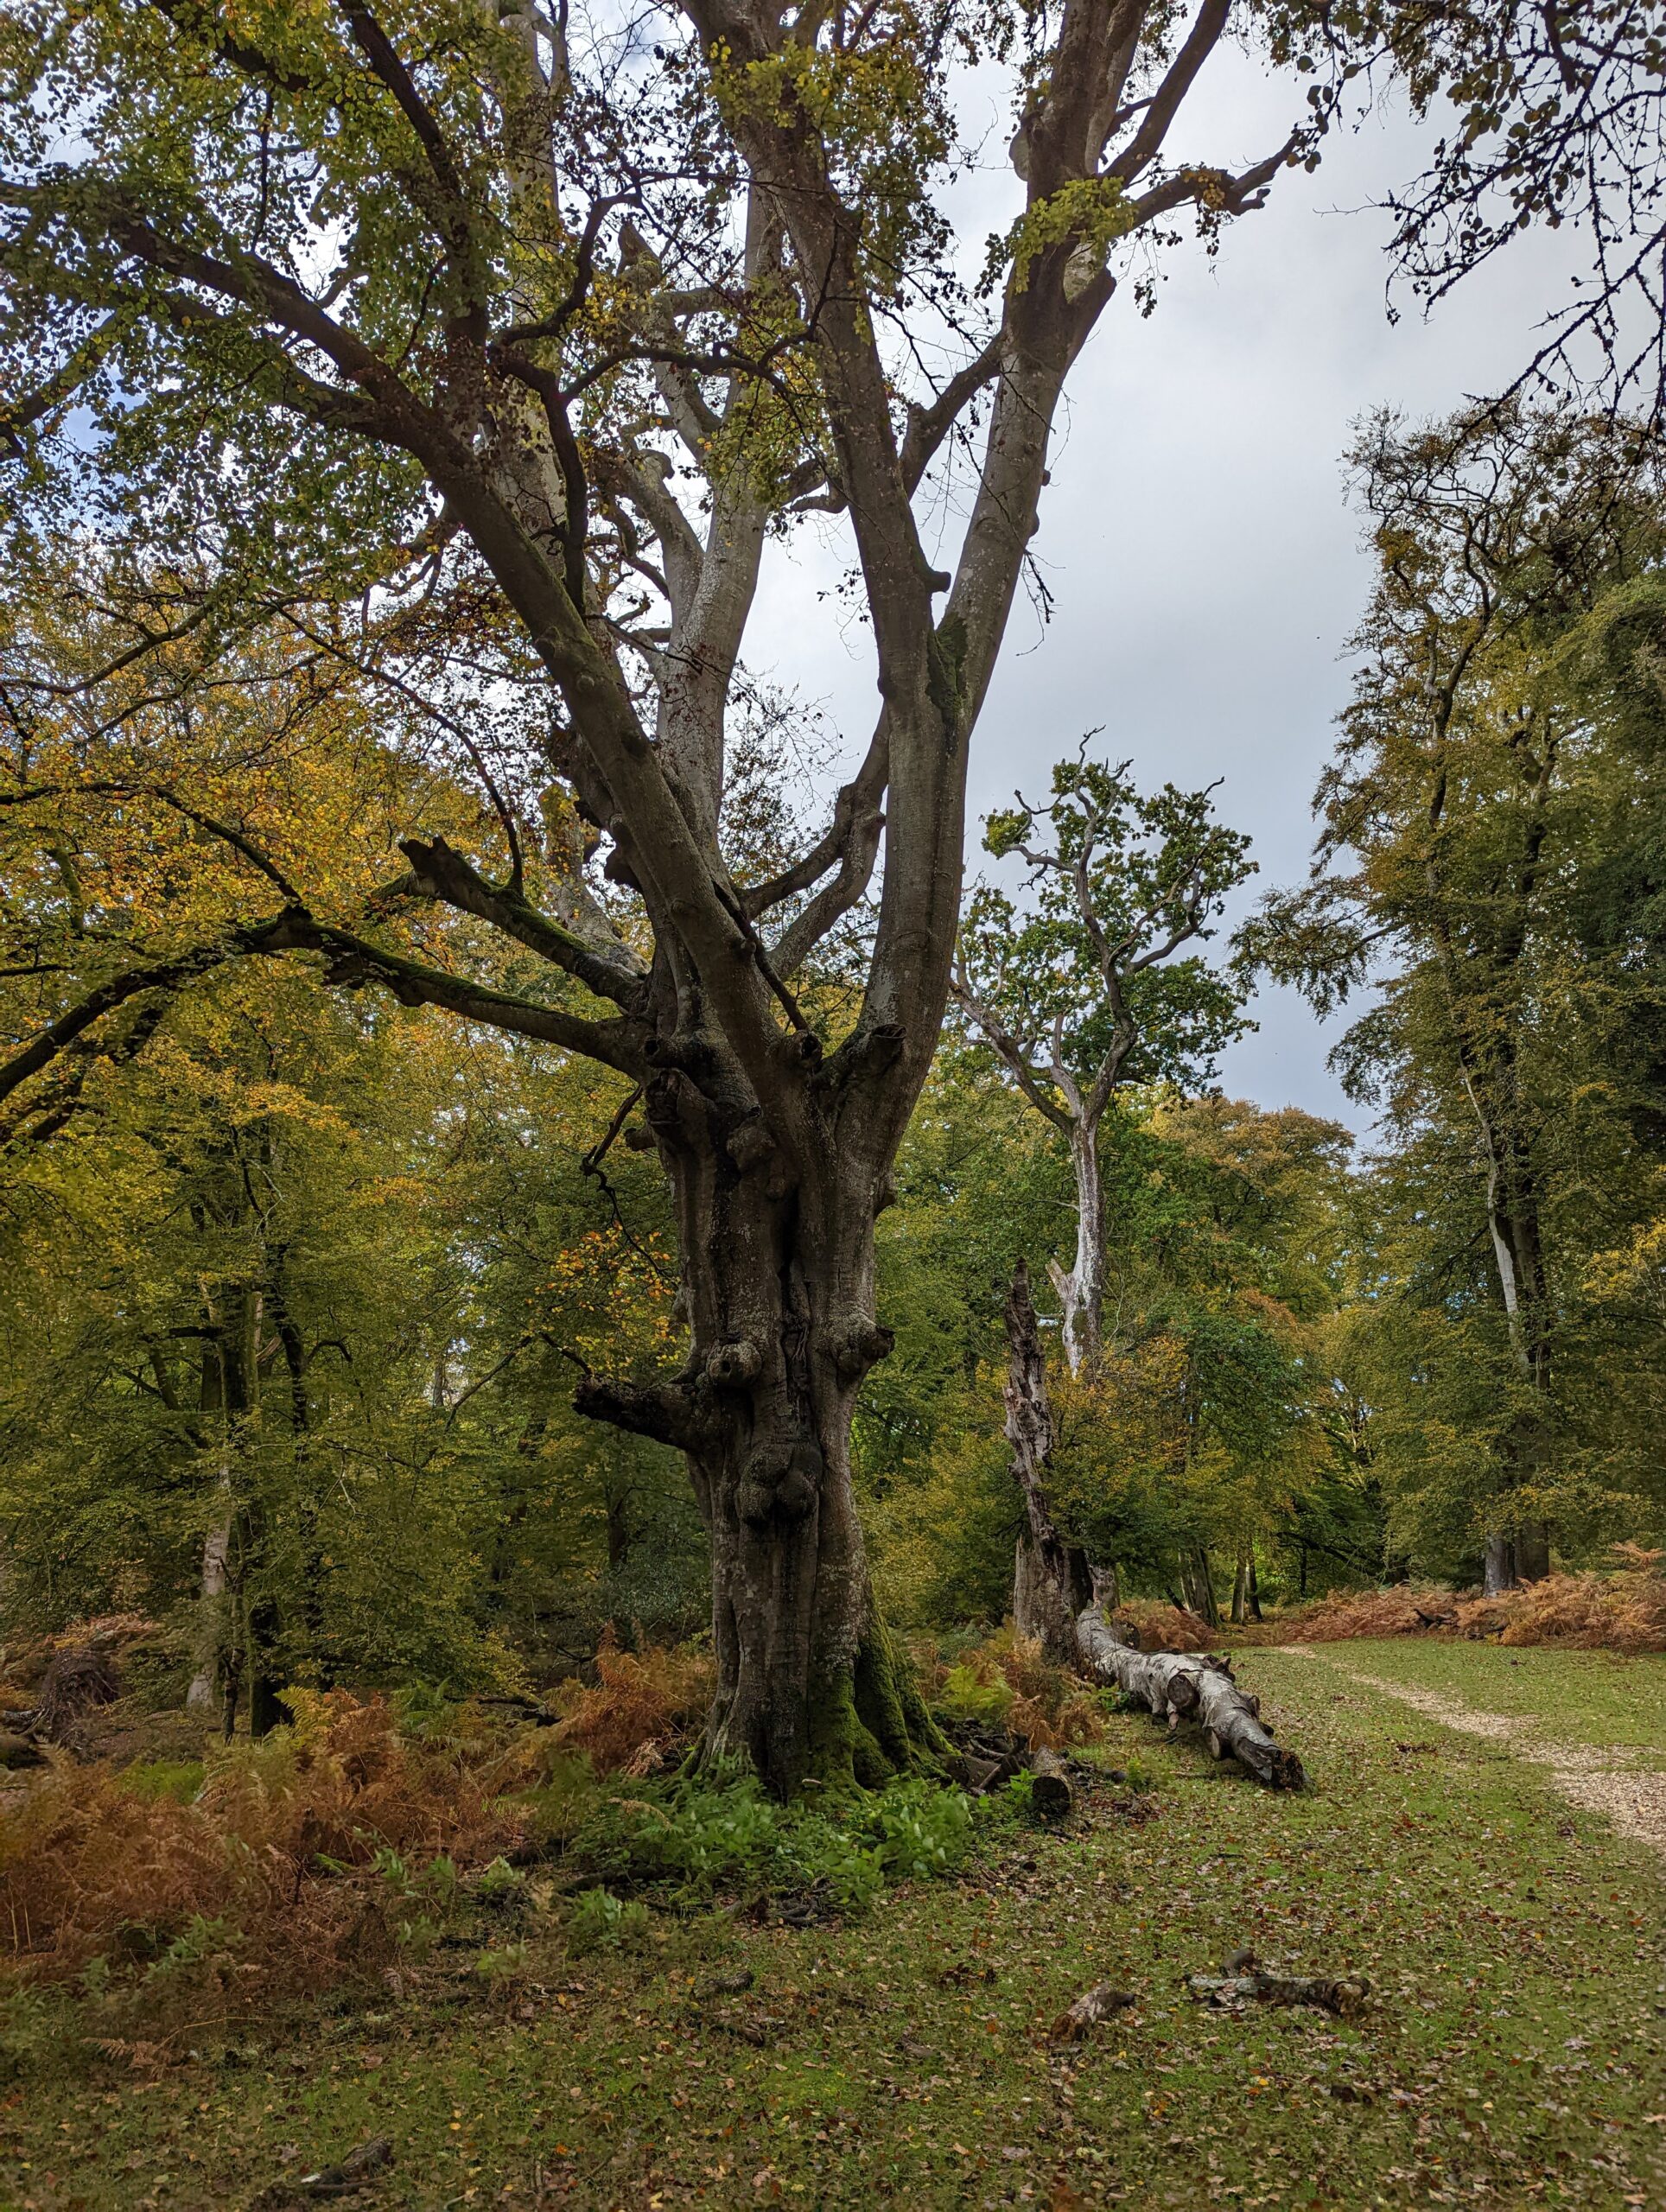
More photos from Dorset, including the Tank Museum, Monkey World and the Slimbridge Wetland Centre on the way back, here.
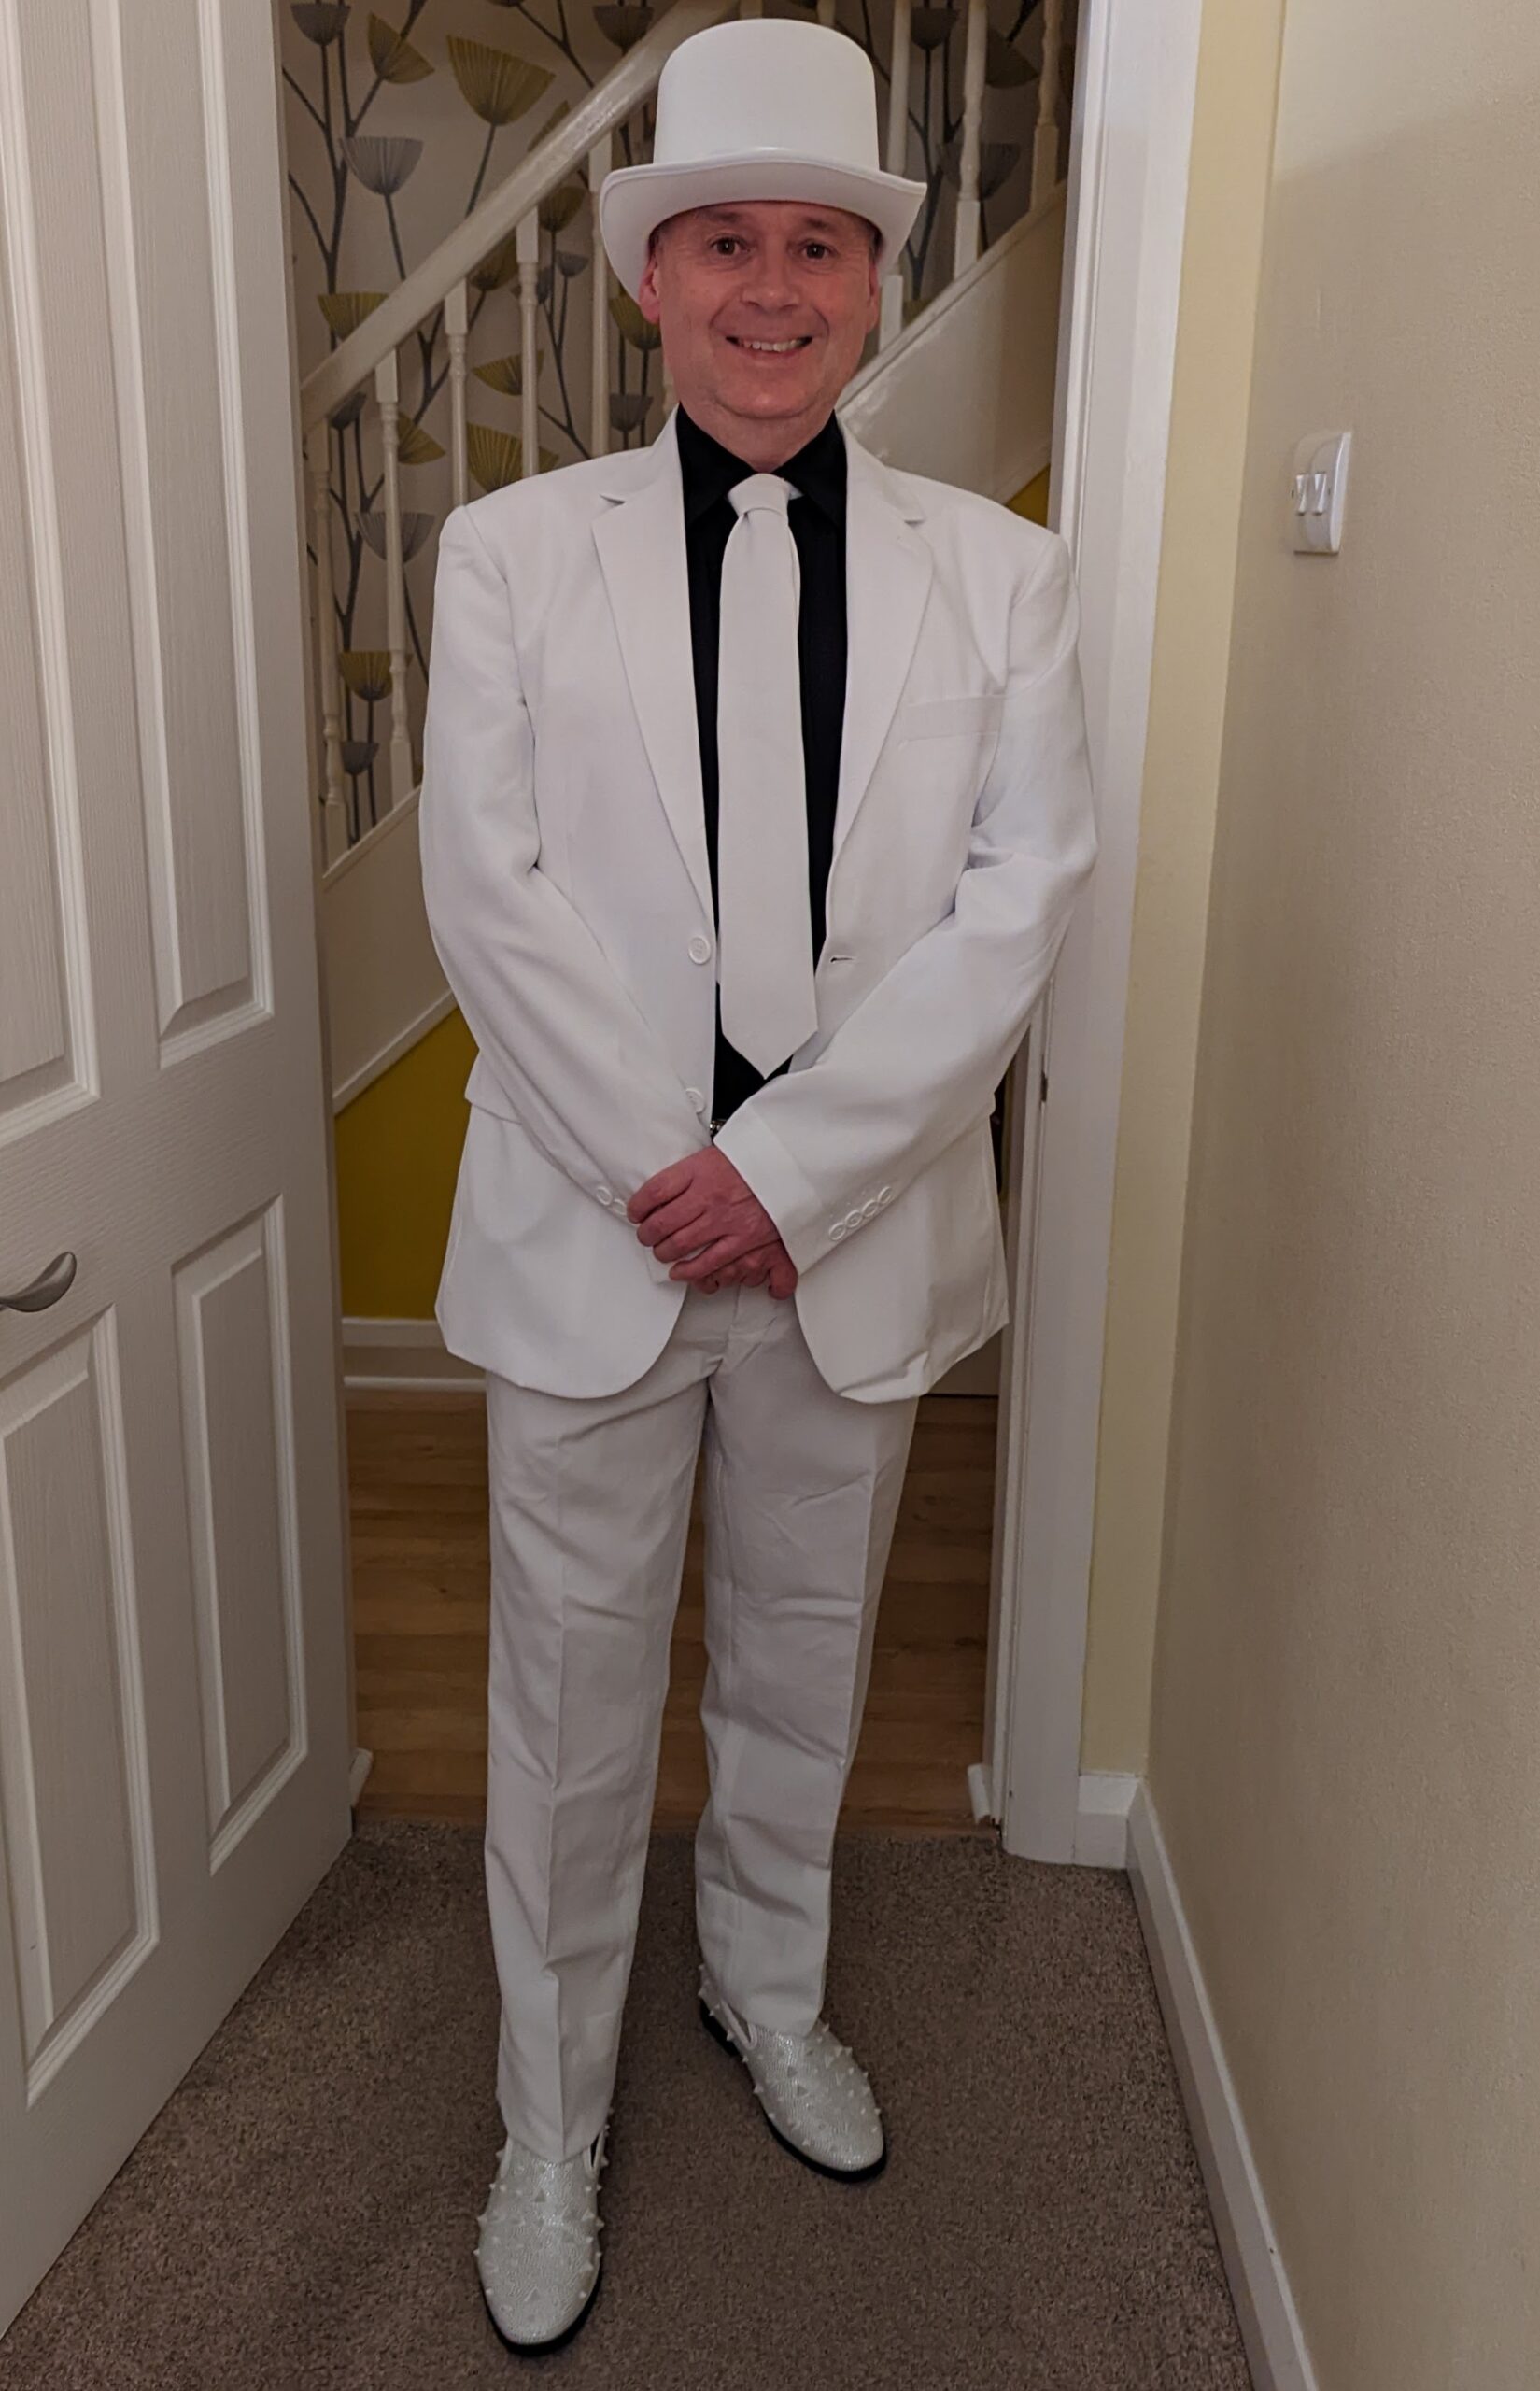
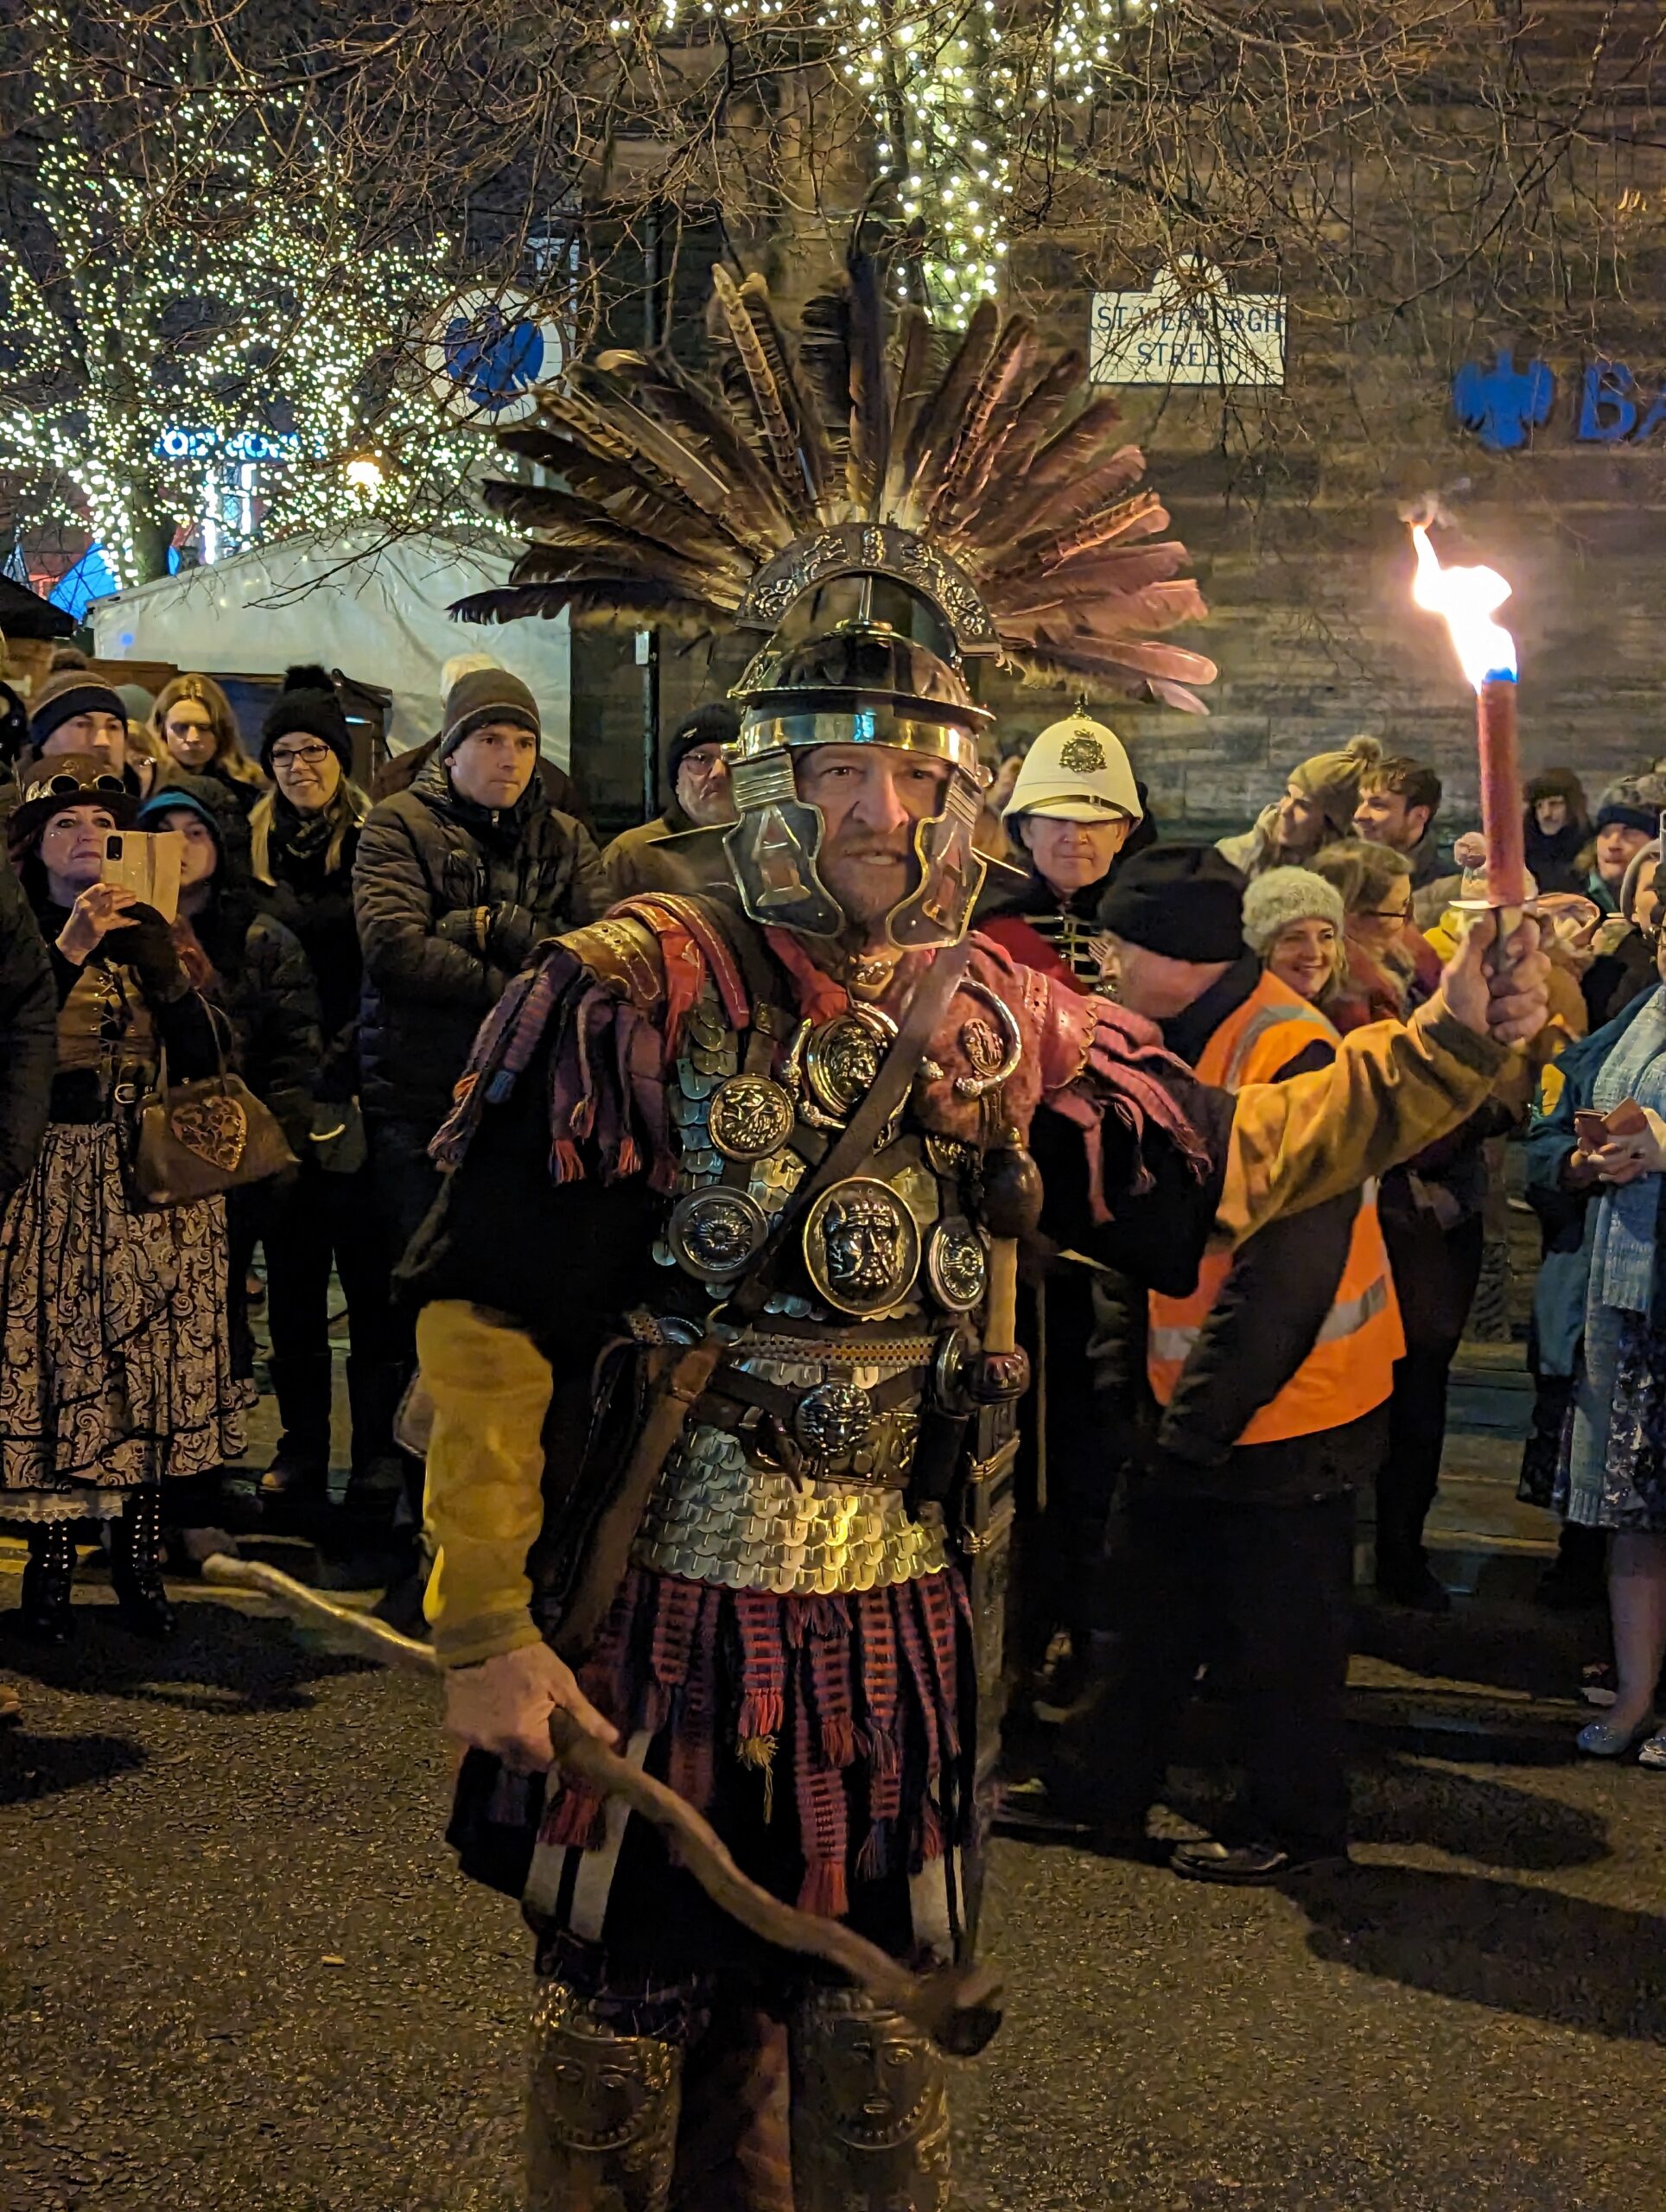
The Winter brought more entertainment, on the left you see me in my suit for the office Christmas Party. It is difficult to appreciate the sparkly-ness of the shoes but they are still out since I enjoy seeing them sparkle. On the right is the chief Roman from Chester’s Saturnalia celebration.
We all got covid earlier in the year, I still haven’t got back to my former running form – 10km in 50 minutes, I can only manage 3km in 15 minutes and struggle to run much further without post-exercise malaise setting in. My Garmin running watch generously tells me I still have the body of a 31 year old, 21 years younger than my calendar age!
I’ve have had quite a lot of counselling for anxiety this year – featuring Eye Movement Desensitization and Reprocessing (EMDR) which I insisted on referring to as “disco lights”. It appears to have worked to some degree although in the depths of winter when I’m not doing anything that induces anxiety it is difficult to tell.